Dogecoin, Tezos, EOS Price Analysis: 09 February

As the Bitcoin fear and greed index jumped by 26 points over last week, XTZ saw staggering gains while seeing an overbought RSI. Also, EOS invalidated its bearish tendencies by marking a close above the up-channel and aiming to retest the $2.6-level. On the other hand, Dogecoin saw a nearly 5% 24-hour loss as it fell towards the half-line of its up-channel.
Dogecoin (DOGE)
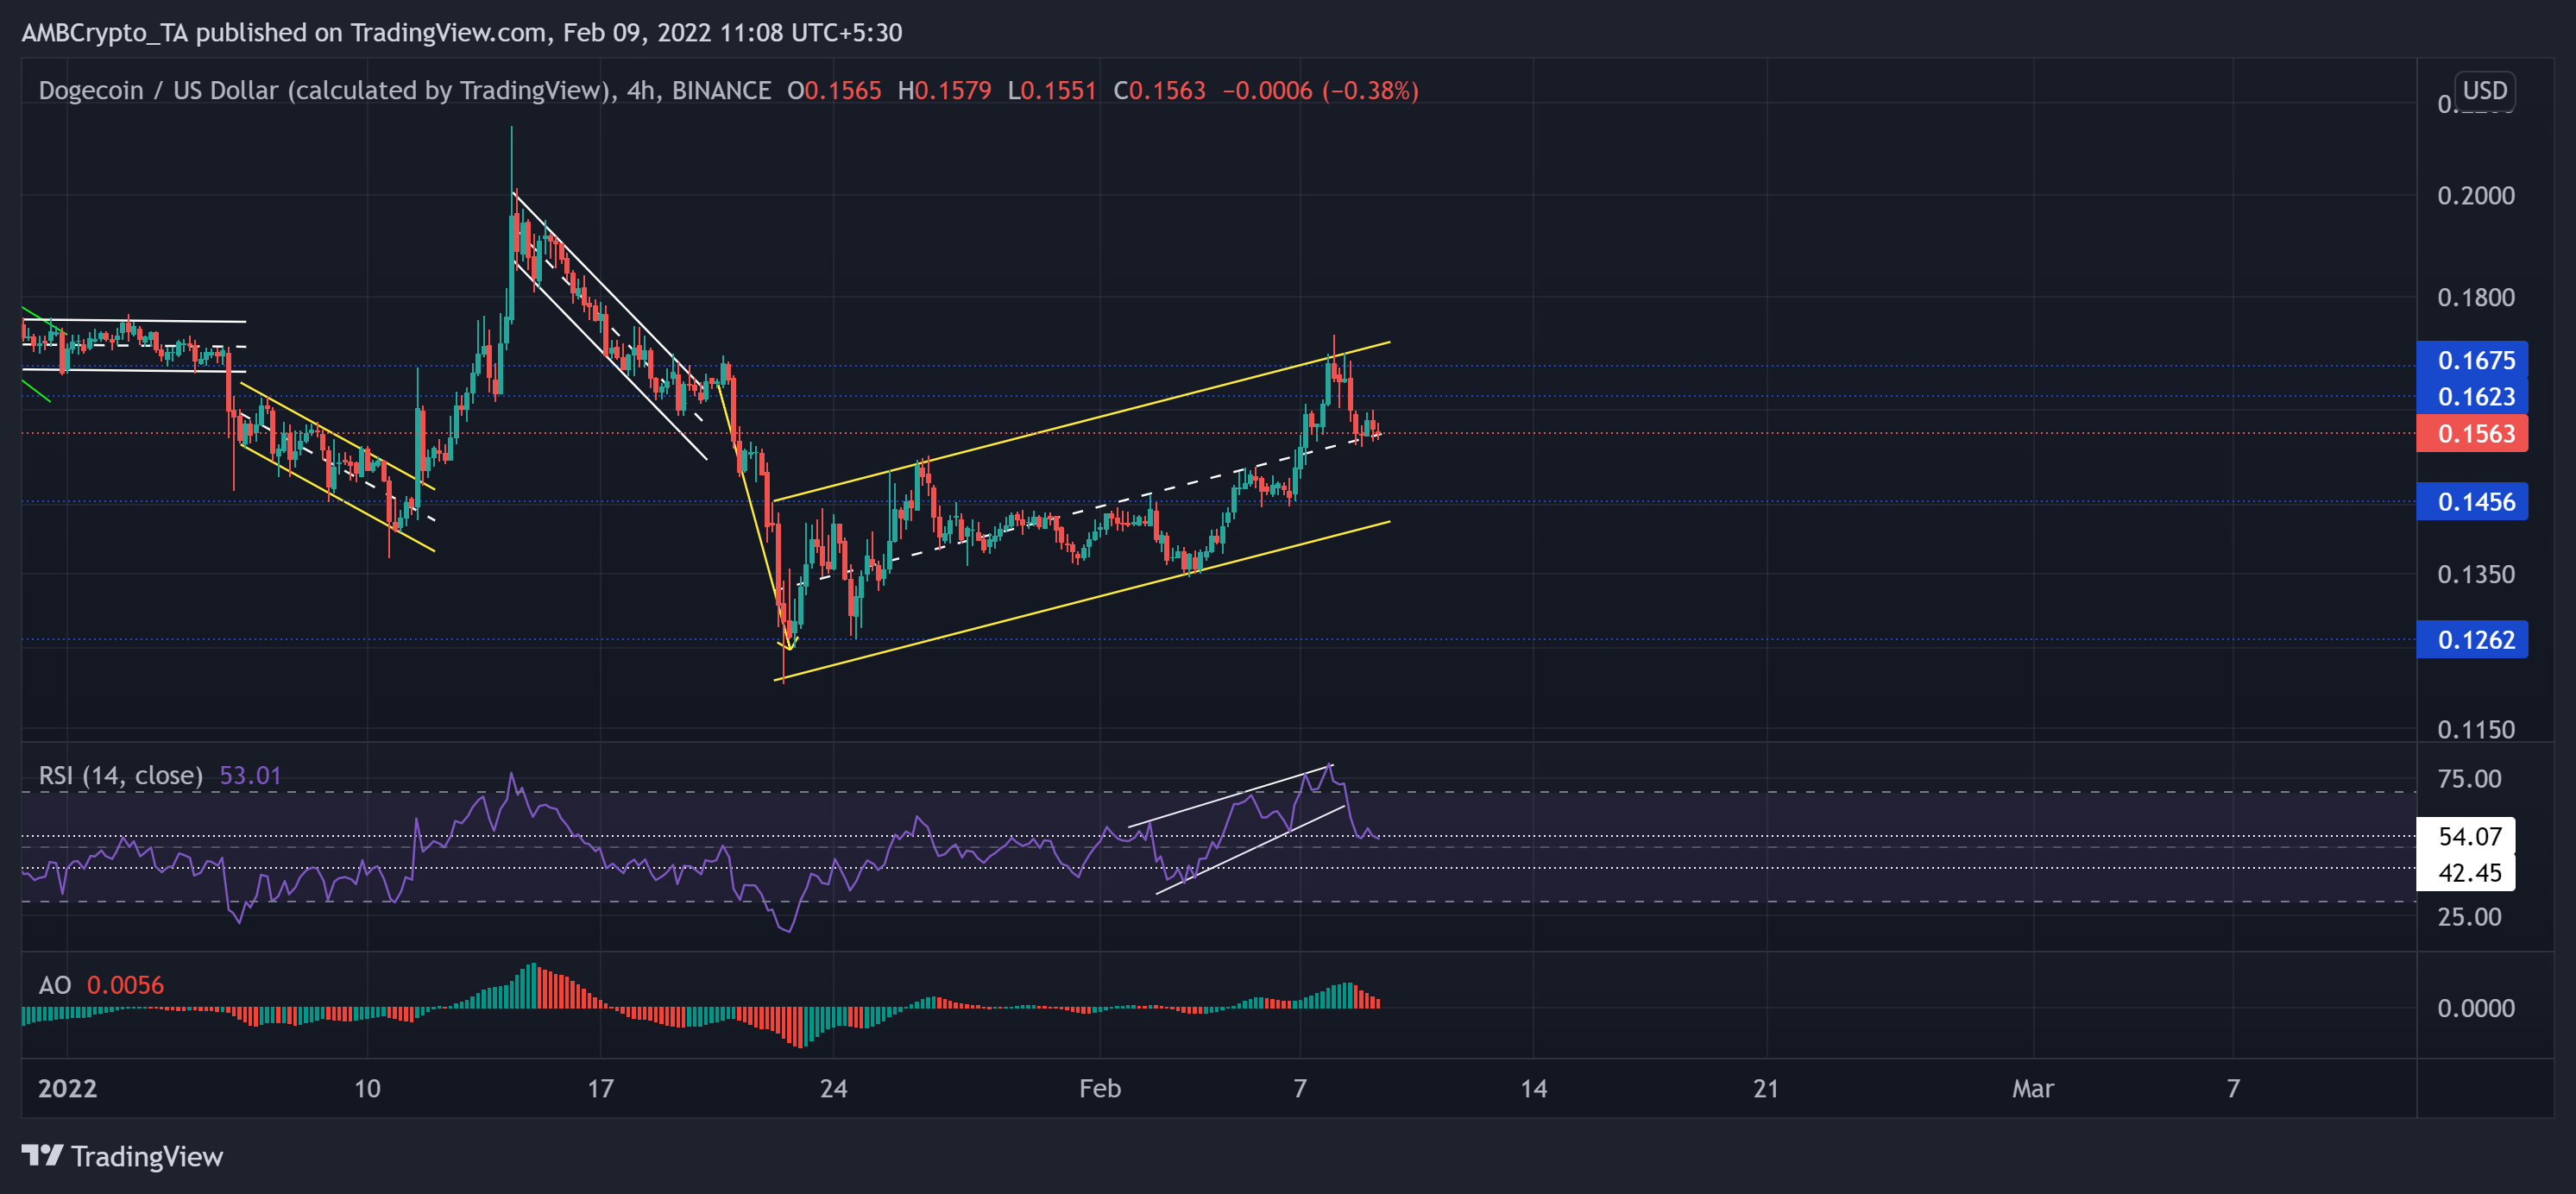
The altcoin saw a 44.03% fall (from 14 January) and hit its nine-month low on 22 January. Since then, DOGE registered over 40 % gains in the last 16 days.
The recovery phase marked an ascending channel (yellow, reversal pattern) on its 4-hour chart. While the $0.167-mark stood sturdy, DOGE saw a 5.09% 24-hour pullback. Now, the immediate hurdle for the bears stood near the half-line of the channel.
At press time, DOGE was trading at $0.1563. After heading into the overbought region, The RSI saw a patterned breakout and lost the 54-mark level. The bulls needed to defend the half-line to avoid a further downfall toward the 42-mark. Further, the AO projected a bullish edge while depicting their decreasing influence over the past day.
Tezos (XTZ)

XTZ witnessed a 51.6% decline (from 5 January) and hit its six-month low on 24 January. However, from the $2.8-level, the alt bounced back to recover the previous losses and reclaimed the vital $3.8-mark support.
The alt witnessed a 75.2% ROI in just the last 16 days (from its six-month low). XTZ also formed an ascending channel (yellow) during this phase. Now, as the sellers seemingly lost the $4.4-mark, the immediate resistance stood at the upper trendline of the channel.
At press time, XTZ was trading at $4.5. Since breaking down from its up-channel (white), the RSI tested the overbought region multiple times and ensured the half-line support. At the time of writing, it hovered around its two-month high, depicting an overbought position. Also, the DMI reaffirmed the bullish vigor while the +DI still looked north.
EOS

The 21 January sell-off saw substantial losses while the alt pierced through vital support levels. As a result, EOS marked a 30.41% decline (from 20 January) and touched its 22-month low on 24 January.
Since then, the alt has seen an up-channel (green) 39.2% recovery in the last 16 days. EOS noted over 11% gains in just two days before reversing from the $2.6-mark resistance. The immediate resistance continued to stand at this mark. Any retracements would find support near the 20 SMA (red).
At press time, EOS was trading above its 20-50 SMA at $2.657. The bullish RSI saw impressive gains as it poked the 80-mark on 8 February. Since then, it found strong support at its trendline.


