Dogecoin traders can enter short positions if this scenario plays out

Disclaimer: The information presented does not constitute financial, investment, trading, or other types of advice and is solely the writer’s opinion
- The market structure flipped bearish recently
- Momentum was firmly on the side of the bears
Since 5 December, the USDT (Tether) Dominance metric has risen from 7.94% to 8.26%, a nearly 4% rise. This showed market participants fled from holding crypto to holding stablecoins. Dogecoin reached a local top on 5 December at $0.1119.
Read Dogecoin’s [DOGE] Price Prediction 2023-24
Over the next week, the idea of another drop was supported by the price action as well as the technical indicators. If Bitcoin also sees weakness in the next few days, fear could grip the market and Dogecoin can reach the lows from November.
Dogecoin presents the possibility of a bearish move, traders can wait for the trigger to enter positions
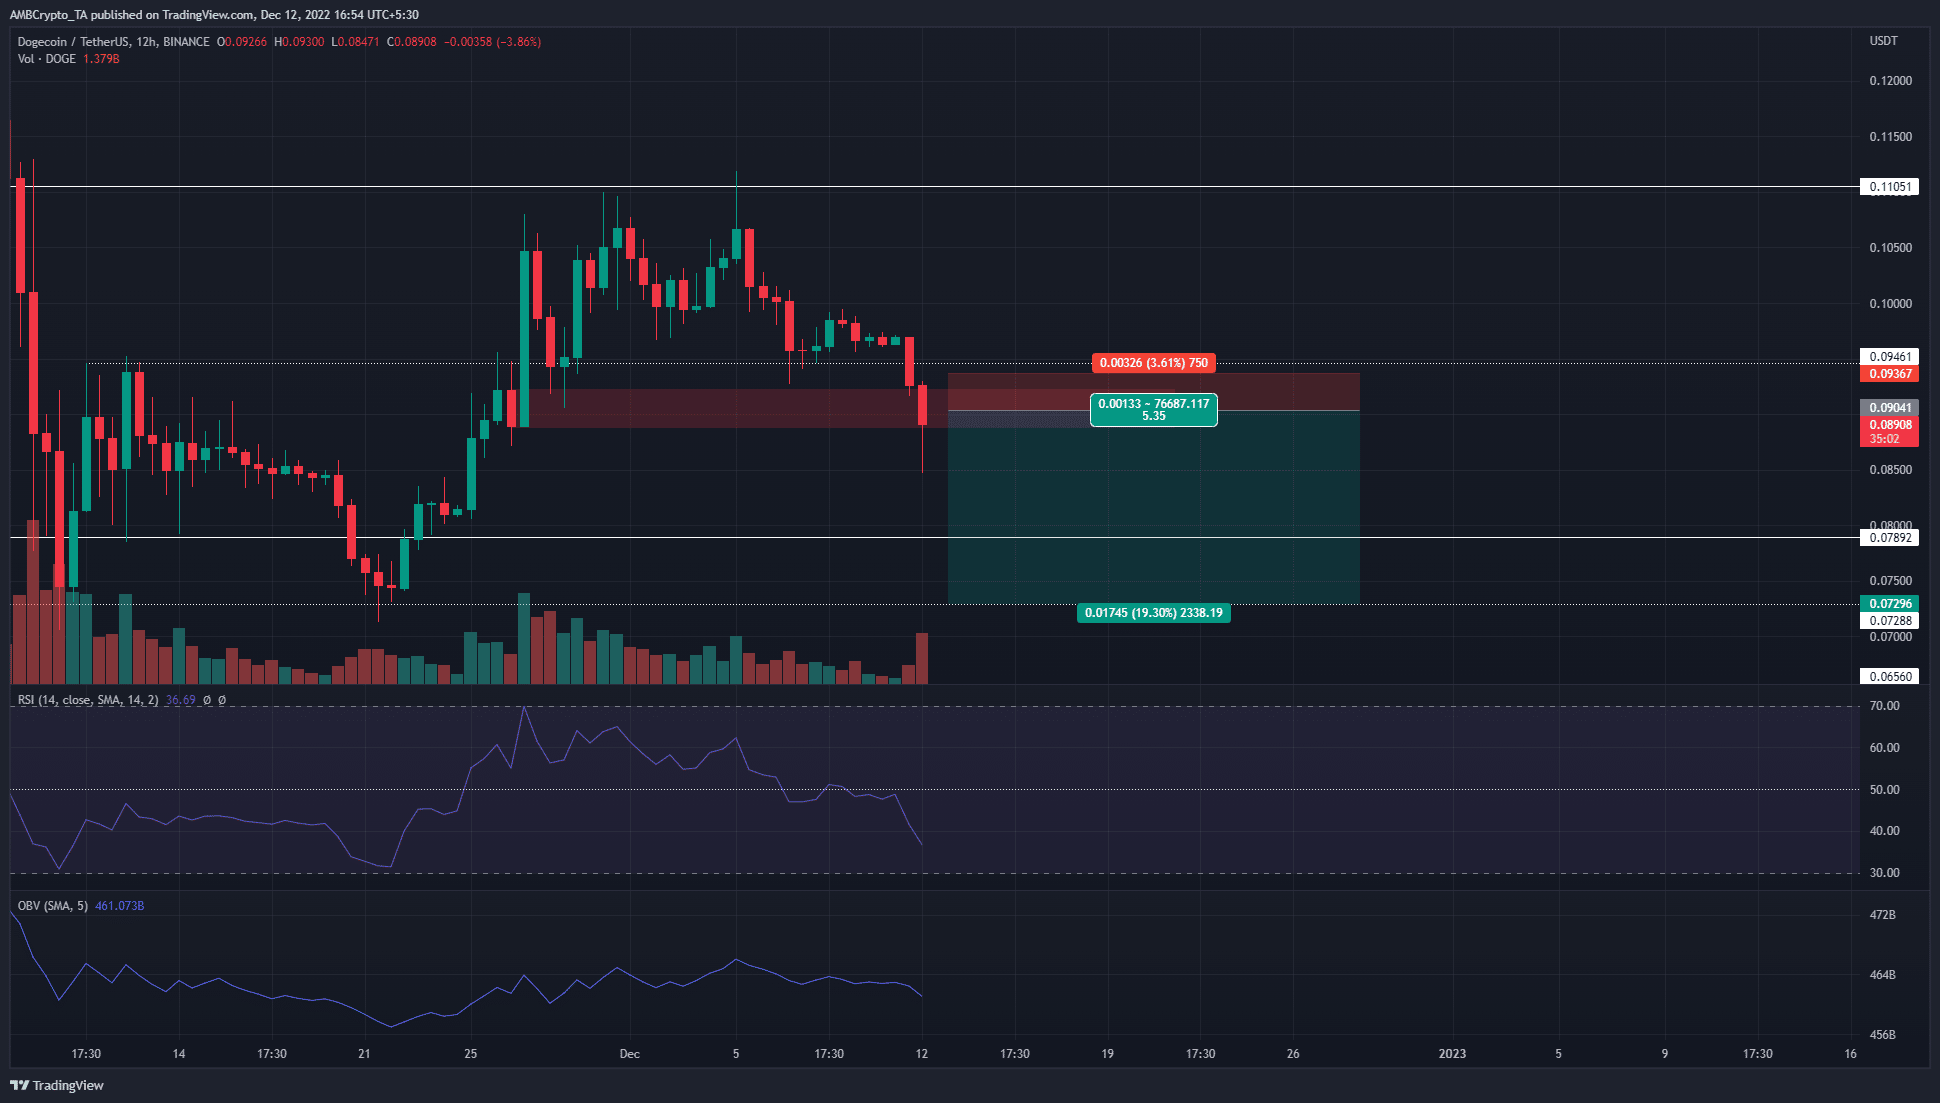
The red box at $0.089 highlighted a bullish order block formed on 26 November. It was tested on 28 November and saw a sharp bullish reaction from DOGE. The price rallied to $0.11, a move that measured nearly 22%.
The past couple of days of trading saw Dogecoin slip beneath the $0.094 support level, and test the order block again. However, the candlewick to $0.085 in recent hours was not an encouraging sign. It indicated that bulls might have lost the battle.
In the next day or two, a move below $0.0888, followed by a retest of the $0.089 area can offer a selling opportunity. The previously bullish order block would have flipped to become a bearish breaker. Sellers can take profit at $0.083 and $0.073. Meanwhile, invalidation of this bearish notion would be a move back above $0.09.
This trade was relatively low risk. The Relative Strength Index (RSI)’s drop below neutral 50 recently showed that a move downward was a likelihood. The On-Balance Volume (OBV) also gradually declined over the past week.
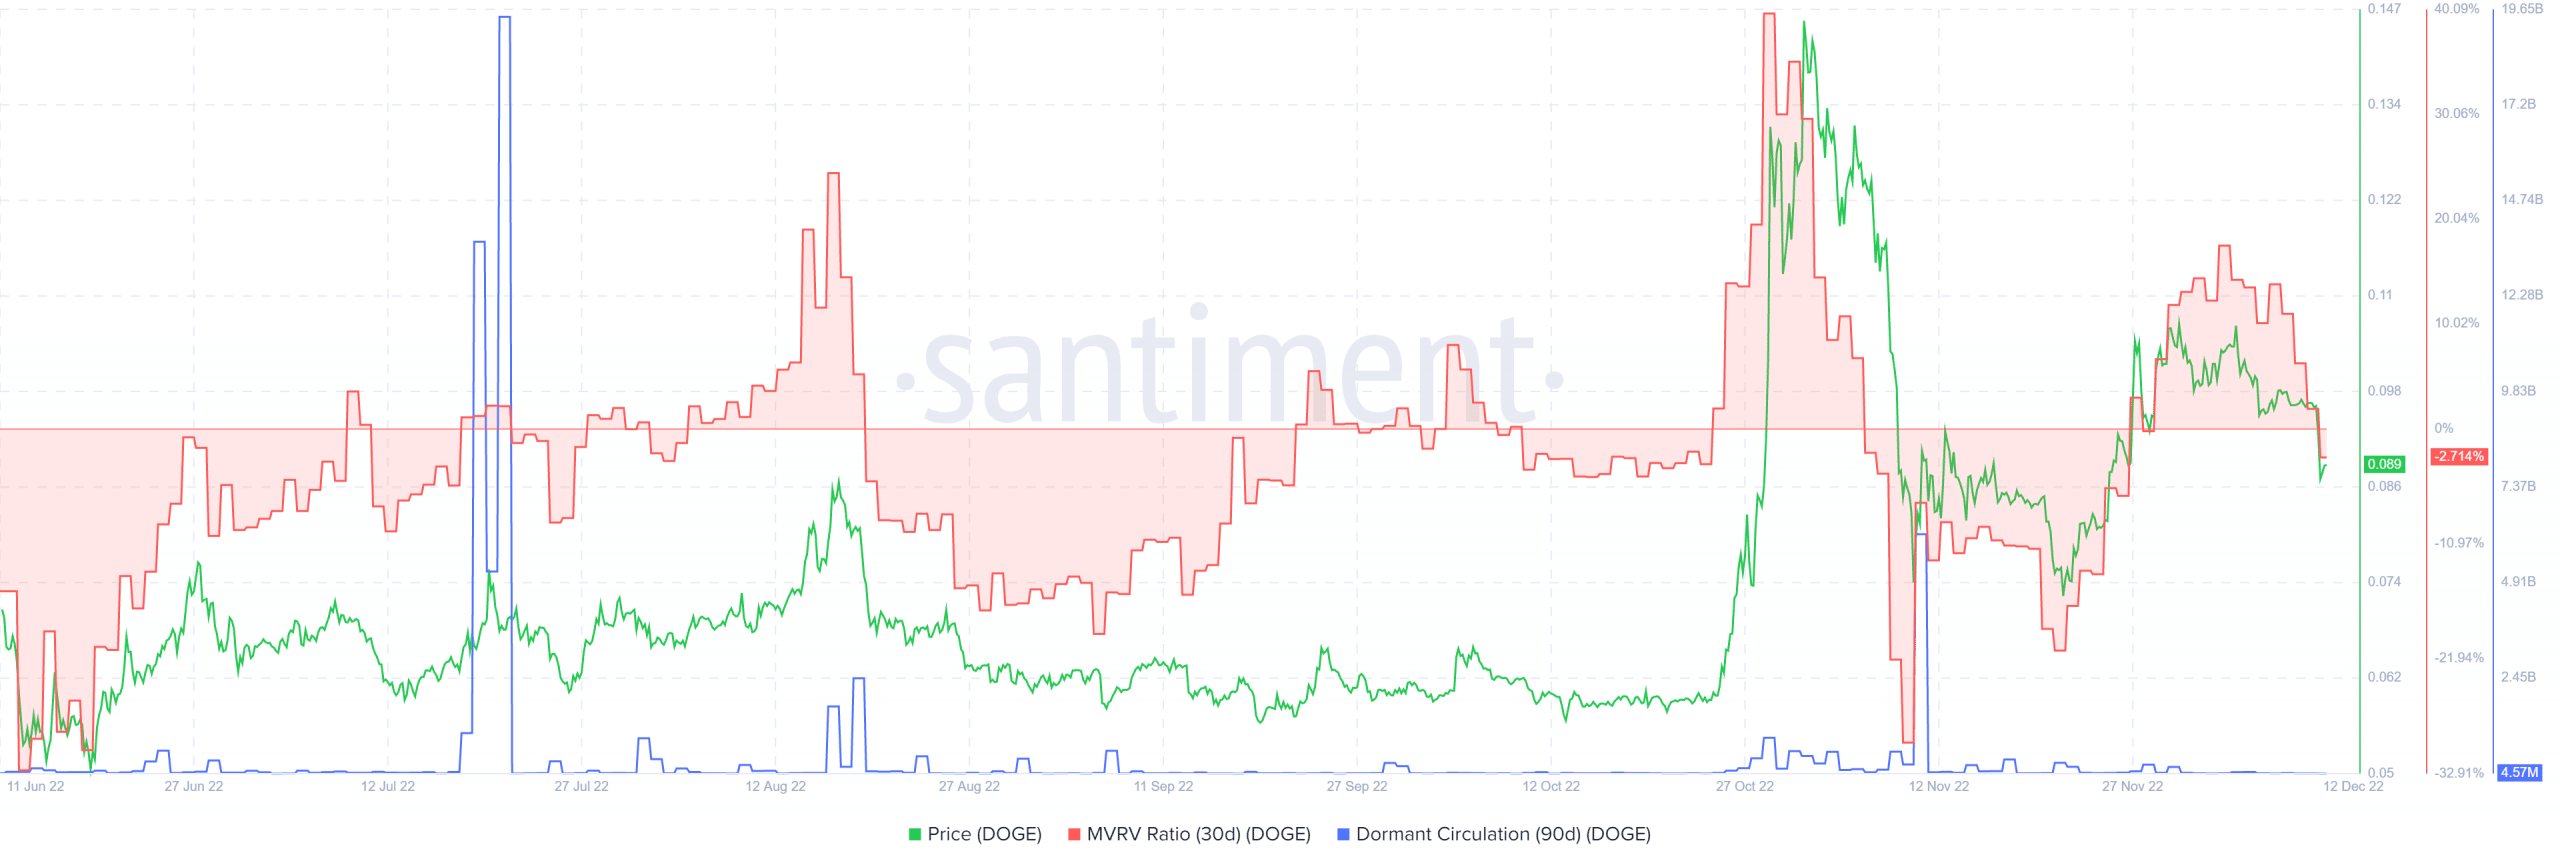
The dormant circulation metric saw sharp spikes on 10 November and 21 July. Both times, the spike was chronologically close to a large price move on Dogecoin. However, since the November spike, another was yet to appear, even though DOGE noted large losses in recent days.
The 30-day Market Value to Realized Value (MVRV) was a more reliable indicator of local tops in recent months. Its ascent past the 10% mark occurred thrice since July and was followed by a steep plunge in prices all three times. At press time the MVRV was back in negative territory, but this might not be indicative of the end of a near-term downtrend.
A retest of the bearish breaker, if it occurs, can be a trigger for short sellers. News in the wider economic sphere and global indices can also have an impact on the performance of the crypto market over the next two weeks.