
Ripple – 3 signals hint XRP could lead altcoins into Q3

- After reclaiming a spot above the 200-day EMA, Dogecoin stood near a critical support level
- Overall long/short ratio on Binance kept some bullish recovery hopes alive
Dogecoin’s [DOGE] recent recovery from the $0.104 support reignited a near-term bullish edge, as the altcoin saw a streak of green candles over the last two weeks. Consequently, the memecoin closed above the 20, 50, and 200-day EMAs.
However, the memecoin struggled to break above the $0.14 resistance and entered a low volatility phase. At press time, DOGE was trading at nearly $0.132.
Can Dogecoin bulls re-enter the market?
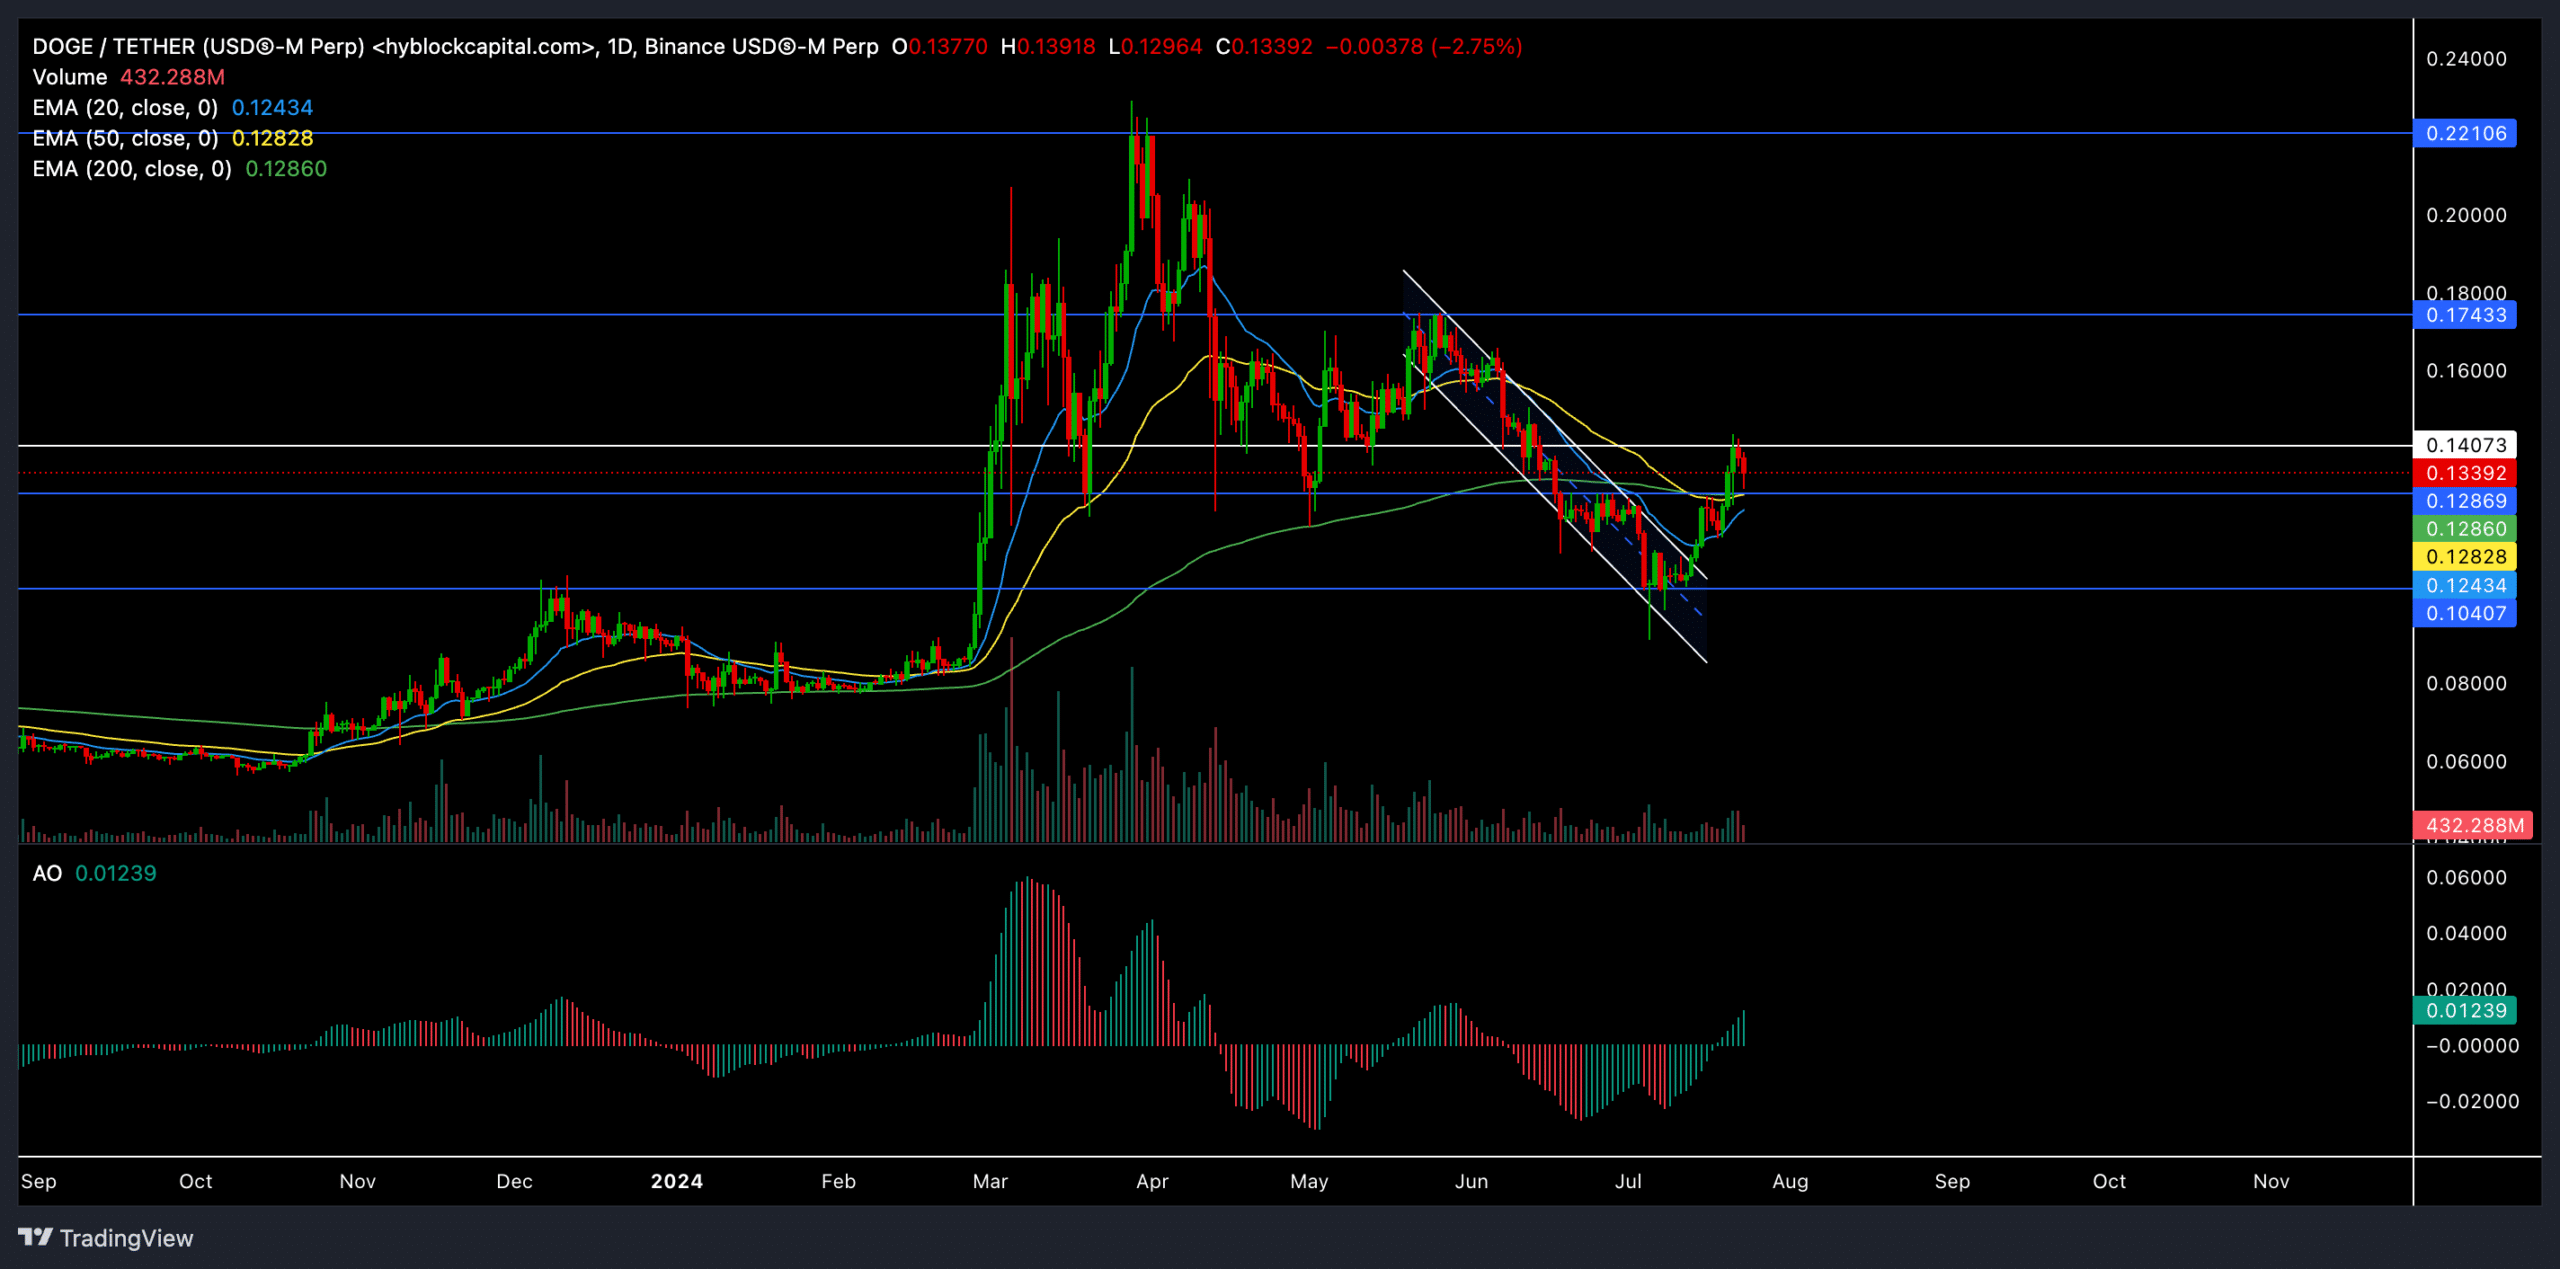
Source: TradingView, DOGE/USDT
After a bullish start in Q1 this year, DOGE touched its two-year high on 28 March. However, the bears entered the market near the $0.22 level and have claimed a rather long-term edge since.
The memecoin struggled to uphold crucial support levels over the next few months as it found a trading range between $0.128-$0.174 range. Over the last four months, DOGE has lost around 41% of its value amid this bearish pressure.
In the meantime, the altcoin formed a classic descending channel structure (white) on its daily chart. After testing the $0.174 resistance multiple times, DOGE’s bears provoked a steep downtrend, one that pulled Dogecoin below the crucial $0.128 support level.
As a result, DOGE saw a sustained close below its 200-day EMA after nearly 7 months. Nonetheless, the $0.104 support level set the stage for bulls to recoup and provoke a patterned breakout in the last few weeks.
This breakout helped the memecoin ease the selling pressure in the short term, as it jumped above 20, 50, and 200-day EMAs. This, after nearly 30% gains in two weeks.
This trajectory has now put DOGE at a crucial spot on its charts, especially as it eyes the $0.128 support that it recently found a close above. The 200-day EMA also stood near this level at press time.
So, a likely rebound from this support level can provoke a near-term rally and help DOGE retest the $0.16 zone in the coming days.
On the other hand, should Bitcoin’s sentiment deteriorate, any close below the $0.128 level can delay any near-term recovery prospects. This is important because DOGE shares a 93% 30-day correlation with BTC.
The Awesome Oscillator saw bullish twin peaks as it closed above its equilibrium at the time of writing. Such a trajectory often means a buying edge in the near term.
Derivates data revealed THIS

Source: Coinglass
According to Coinglass, at press time, the overall long/short ratio for the past 24 hours was 0.8864, indicating more short positions than long ones. This aligned with the recent losses on the charts.
However, Binance DOGE/USDT showed a long/short ratio of 3.3085 for accounts and 3.6019 for top traders (accounts) – A sign that some traders still hold bullish views.


