Dogecoin: Traders should watch out for these levels as DOGE holds on to $0.08

Disclaimer: The findings of the following analysis are the sole opinions of the writer and should not be considered investment advice
Dogecoin saw a huge drop in the month of May after the $0.125 support level gave way to a 35% drop in prices within a few days for DOGE. The $0.11 level was also retested as resistance on the way down. With Bitcoin trading within a range over the past two weeks, DOGE has also been trading with lowered volatility, as it held on to a support level at $0.08. However, another drop can not yet be ruled out, for either Bitcoin or Dogecoin.
DOGE- 1 Day Chart
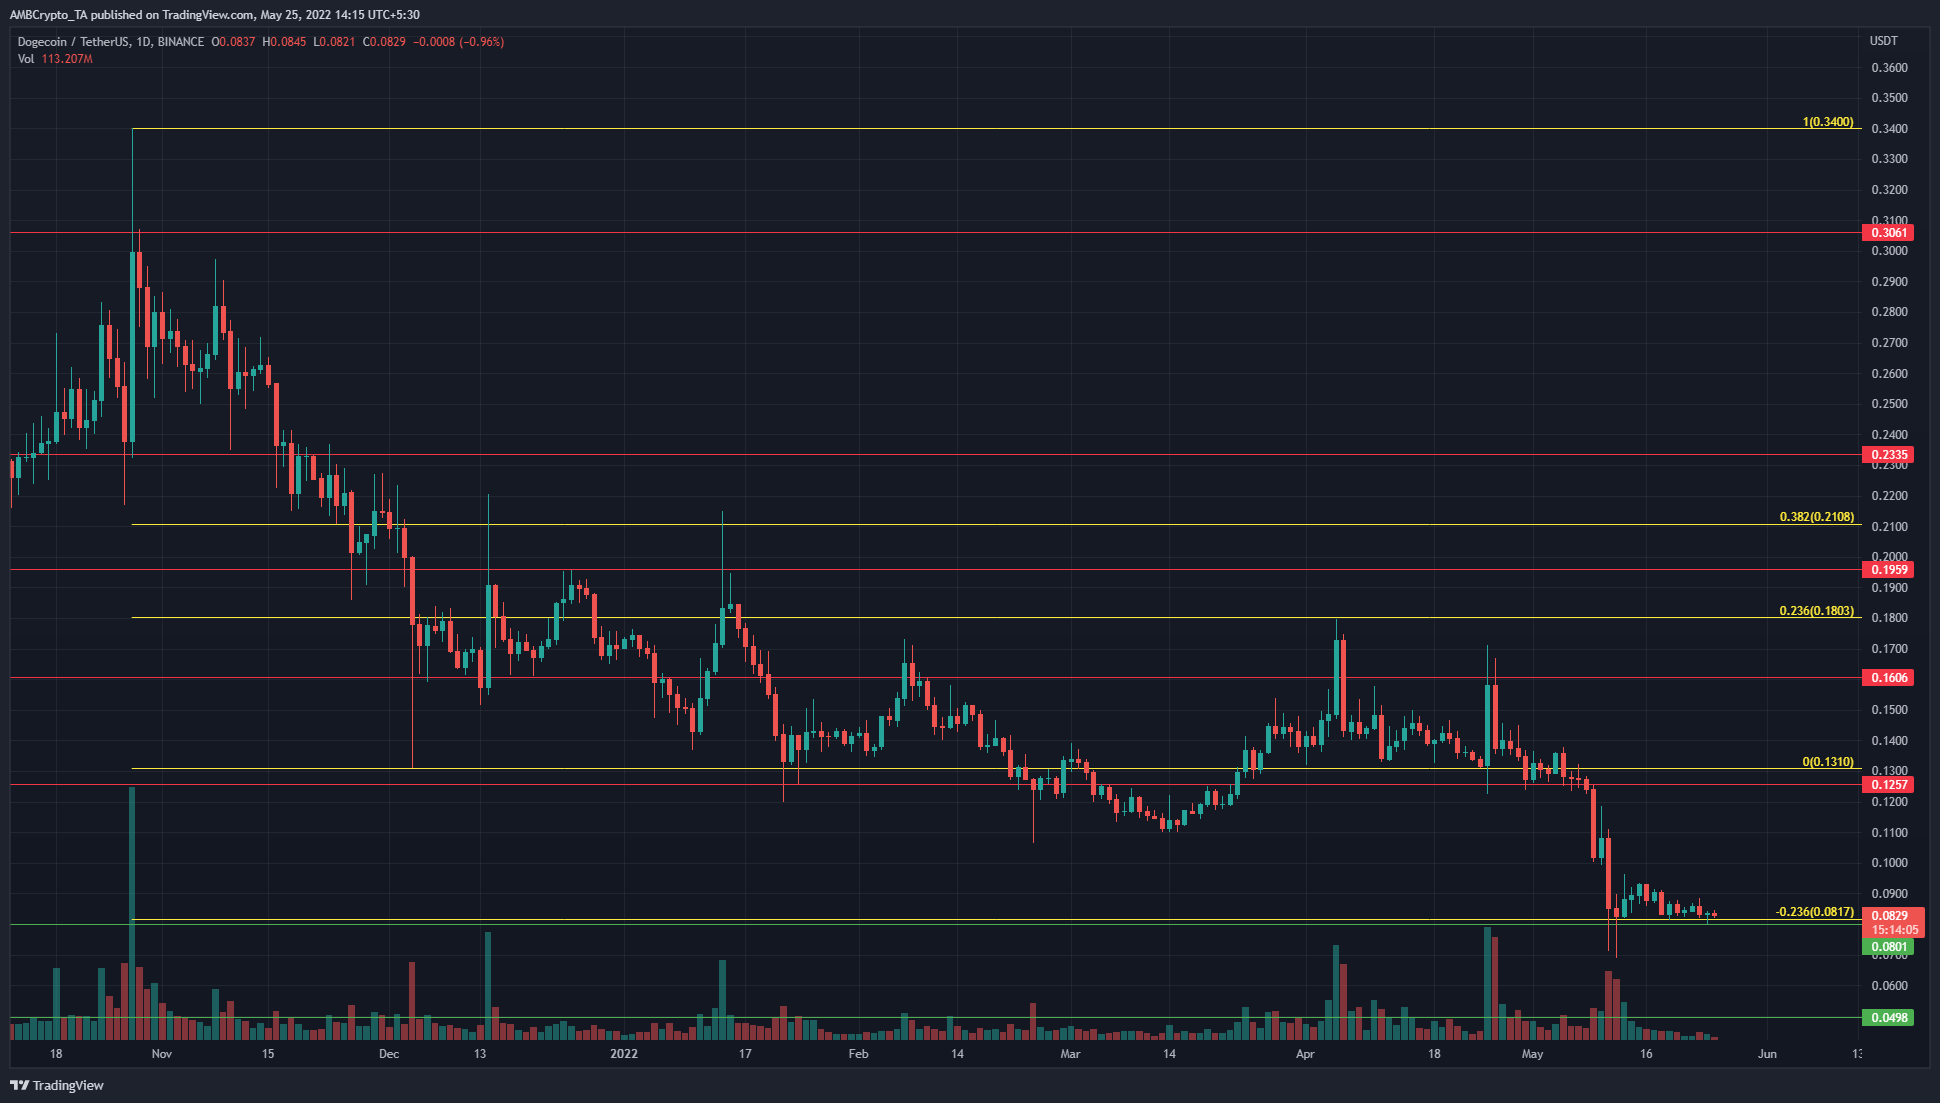
A set of Fibonacci retracement levels (yellow) was drawn from the $0.34 swing high to the $0.13 swing low, and the 38.2% retracement level acted as resistance in December and January.
At the time of writing, the price has found support at the $0.082 level, which is the 23.6% extension level of the aforementioned move. Moreover, the $0.08 level has also been a horizontal level of significance in the past, when it acted as resistance in February 2021.
Below $0.082, the $0.066 and $0.05 levels of support can be places where DOGE can be expected to have a reaction. However, these levels are 24% and 40% respectively from where DOGE was trading at press time.
The price action has a bearish structure on longer timeframes, with a series of lower highs and lower lows. Therefore, long-term investors could save capital by waiting for a buying opportunity or even look to short the asset on a drop below the support level of $0.08.
Rationale
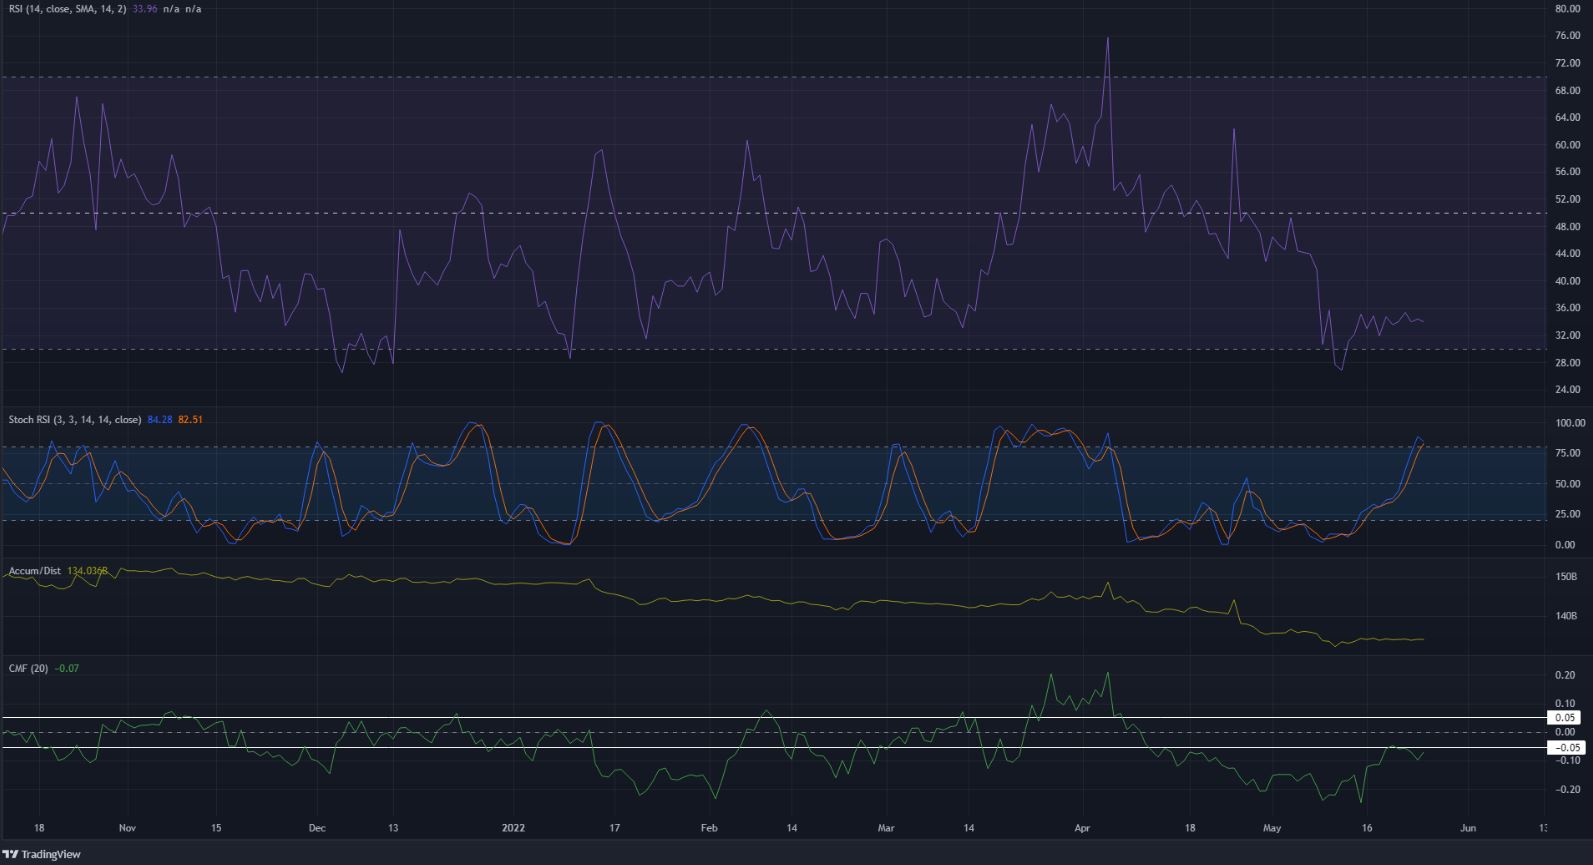
The RSI climbed above neutral 50 in the latter half of March, as Dogecoin rallied from $0.11 all the way to the $0.18 level. However, following this rally, the RSI slipped back beneath neutral 50 while the price also sank beneath the $0.125 support. At the time of writing, the RSI stood at 33.9 and denoted a bearish trend behind the price.
The Stochastic RSI was on the verge of forming a bearish crossover in overbought territory, while the A/D also continued to dip to show strong selling pressure. Alongside, the CMF continued to remain below -0.05 to show significant capital flow out of the market, another sign of bearish pressure.
Conclusion
The bearish structure for Dogecoin was not yet broken on the higher timeframes and long-term investors might want to wait for the trend to shift in favor of the buyers before buying. On the other hand, a drop below $0.08 could see a 25% or even a 40% drop.