
- Low social media engagement and falling on-chain activity are urgent concerns for DOGE
- October’s lows would be the next price targets for DOGE
Dogecoin [DOGE] has fallen by 20% from Saturday’s high at $0.171. In the last 24 hours, there were $37.15 million worth of liquidations across all exchanges for DOGE alone. Of these, $31.87 million or 85.78% were long positions.
Dogecoin saw a 22.6% price slide in 24 hours, and Bitcoin [BTC] shed 10.68% of its value after panic spread across global markets in the wake of the trade war developments. More losses might be likely and hence, investors need to be patient.
Social media engagement dries up as bearish trend drives prices lower

Source: Santiment
Daily active addresses saw a major uptick in November. Since then, it has fallen towards levels that it has maintained since January. Another surge in activity came in mid-March, but it was quick to taper off too.
The social dominance trend has also been falling. March was not the most bearish month for DOGE, despite the heavy price losses. Similarly, the social volume also set new lows in April. This meant that unless the price trend changes direction, attention and capital flows will continue to leak out of the market.
There was a surge in social dominance on 12 March when the daily active addresses leaped higher. This, after a 20% price bounce from the local lows in a day, highlighting the importance of bullishness to the Dogecoin market.

Source: Coinglass
The funding rate crept into negative figures after a week of valiant efforts from the bulls.
This underlined the favorable conditions for sellers. Although it must be noted that the price has tended to bounce higher in the short-term whenever the FR has leaned negative.
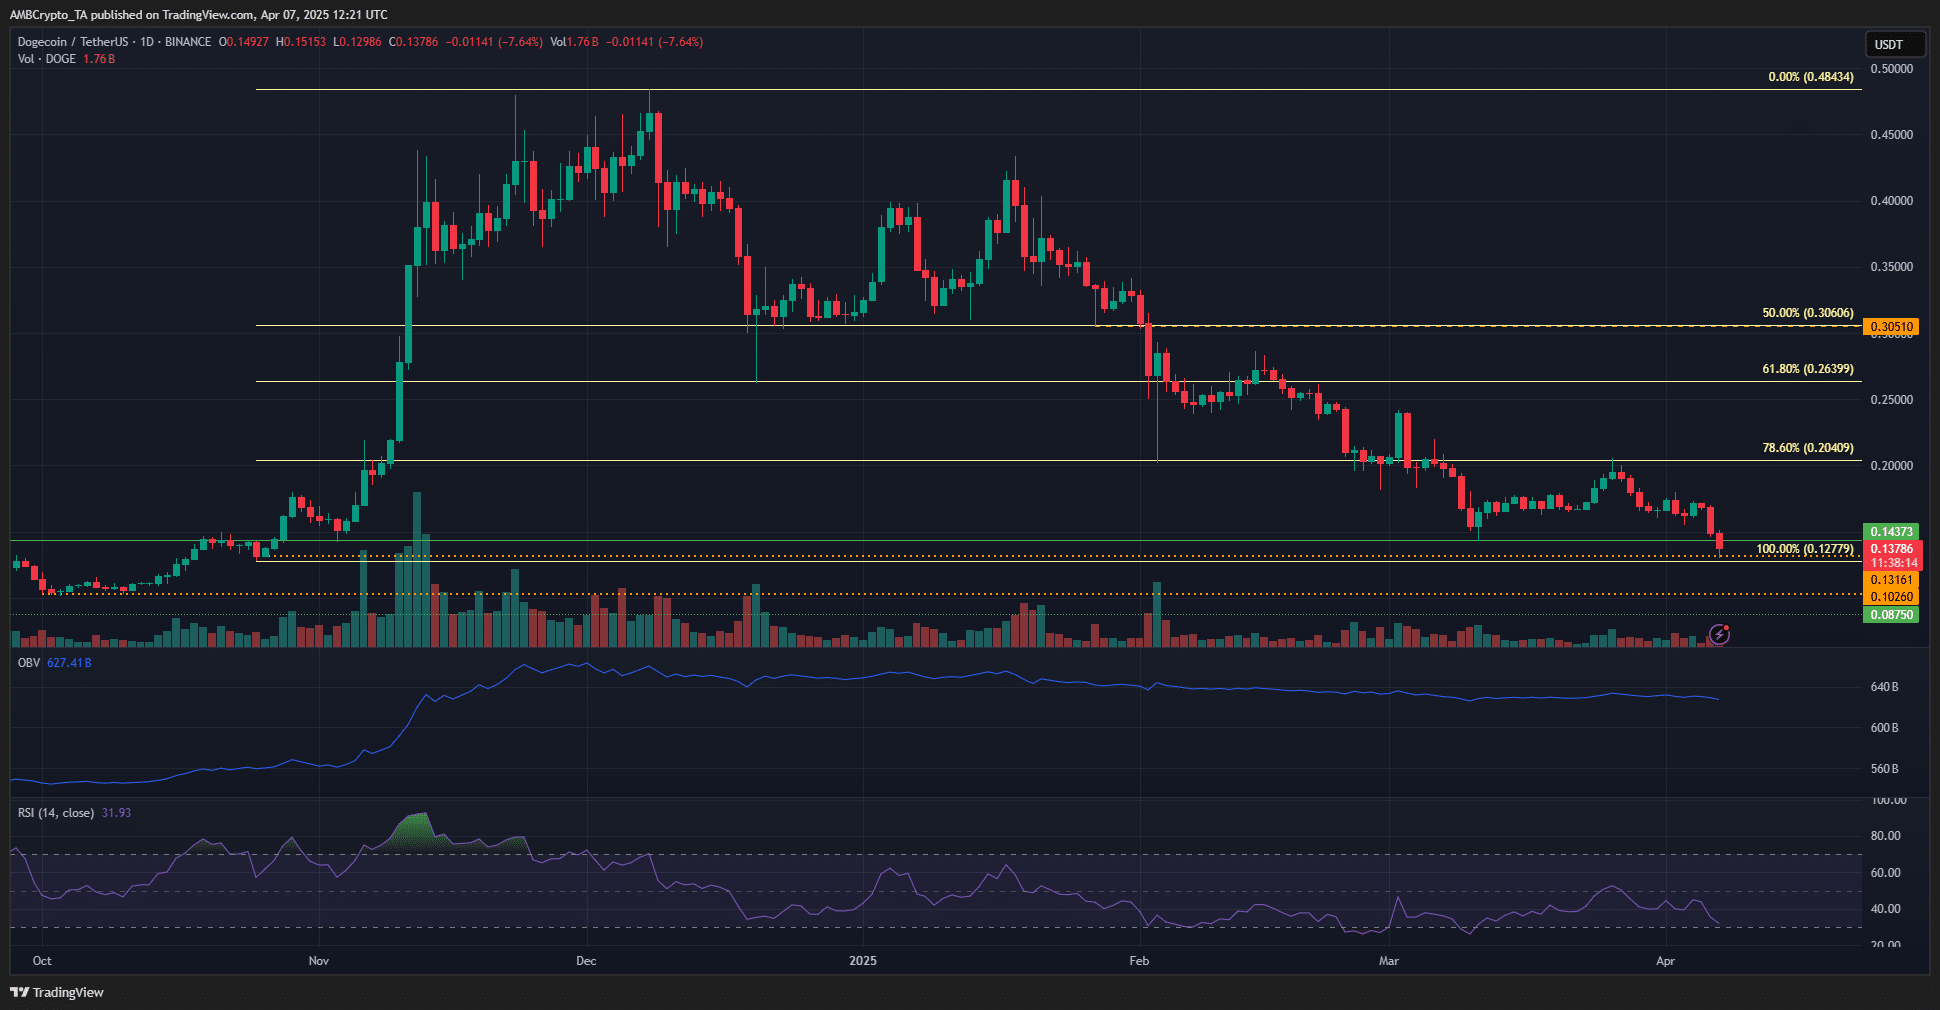
Source: DOGE/USDT on TradingView
The 1-day Dogecoin chart underlined steady selling pressure since December, with the OBV slowly but steadily falling lower. The RSI was below neutral 50 since mid-January – Indicative of a bearish trend in progress.
The $0.131 and $0.102 support levels from October 2024 are now the next price targets. The former has been tested in recent hours, and could yield a bounce to $0.154-$0.164. Despite a potential 15% bounce, however, the trend will be firmly bearish in the near term.
![Bittensor [TAO] tops the AI charts once again, but 3 hurdles loom](https://ambcrypto.com/wp-content/uploads/2025/04/420567A0-9D98-4B5B-9FFF-2B4D7BD2D98D-400x240.webp)


