Dogecoin
Dogecoin’s demand falls 18% in 7 days as DOGE declines 1% – Why?
DOGE’s key momentum indicators show that neither the buyers nor sellers have clear market control.


- The demand for DOGE has declined.
- This has caused its price to trade within a range.
The demand for Dogecoin [DOGE] has declined in the last week, on-chain data has shown. This decline in DOGE’s network activity has caused its price to oscillate within a tight range, forming a horizontal channel.
While DOGE’s price fell by 1% during the period under review, the values of other leading meme assets climbed.
For example, CoinMarketCap’s data showed that in the past seven days, the prices of Shiba Inu [SHIB]
, Pepe [PEPE], dogwifhat [WIF], and Bonk [BONK] climbed by 9%, 14%, 35%, and 30%, respectively.DOGE trends within a range
According to IntoTheBlock’s data, the daily count of addresses that completed transactions involving DOGE has cratered by 18% in the past seven days.
Likewise, new demand for the meme coin has declined. According to the same data provider, the number of new addresses created to trade DOGE during the period under review has fallen by 21%.
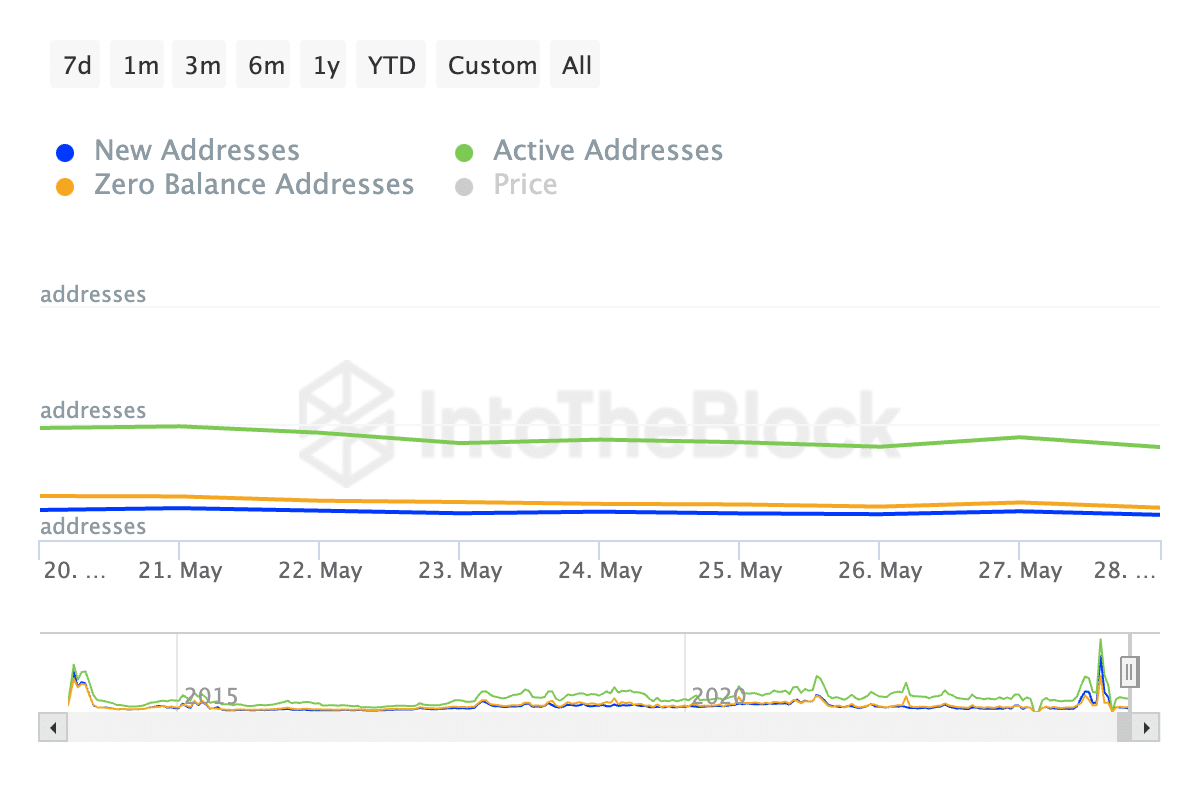
Source: IntoTheBlock
A decline in an asset’s daily active addresses and addresses hints at a decrease in the overall trading volume associated with the asset.
According to Santiment’s data, DOGE’s daily trading volume peaked at $3.01 billion on 24 May and has since fallen by 53%.
The decline in the coin’s trading volume in the last week is partly attributable to the negative sentiment that has trailed DOGE for most of the moment.
In fact, on the 24th of May, its Weighted Sentiment plummeted to a year-to-date (YTD) low of -1.56.
As of this writing, DOGE’s Weighted Sentiment was -0.35, confirming the negative bias surrounding the leading meme coin.
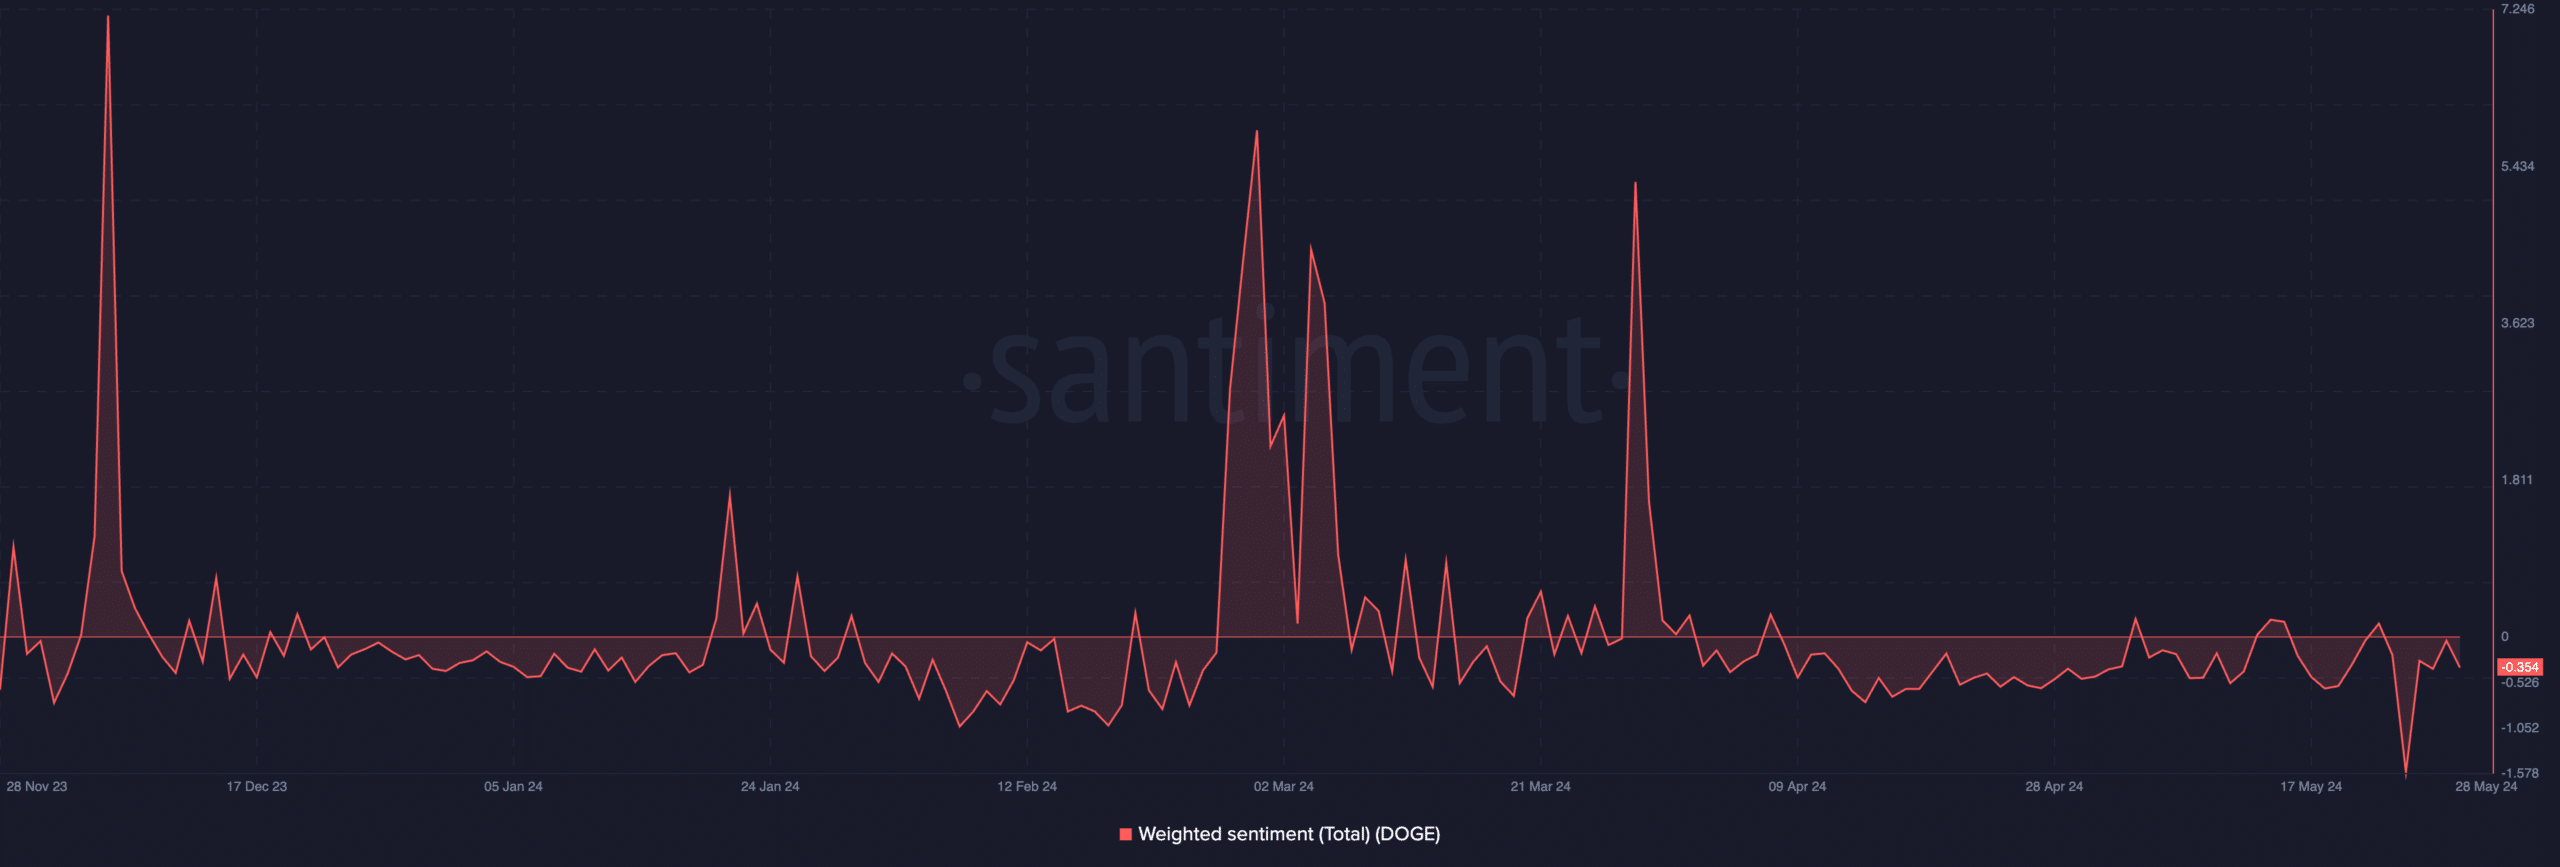
Source: Santiment
When an asset’s price trends within a range, there is a balance between buying and selling pressures, with neither the bulls nor the bears able to trigger a trend in their direction.
The values of DOGE’s key momentum indicators confirmed this. Its Relative Strength Index (RSI) was 53.52 at press time, while its Money Flow Index (MFI) was 55.72.
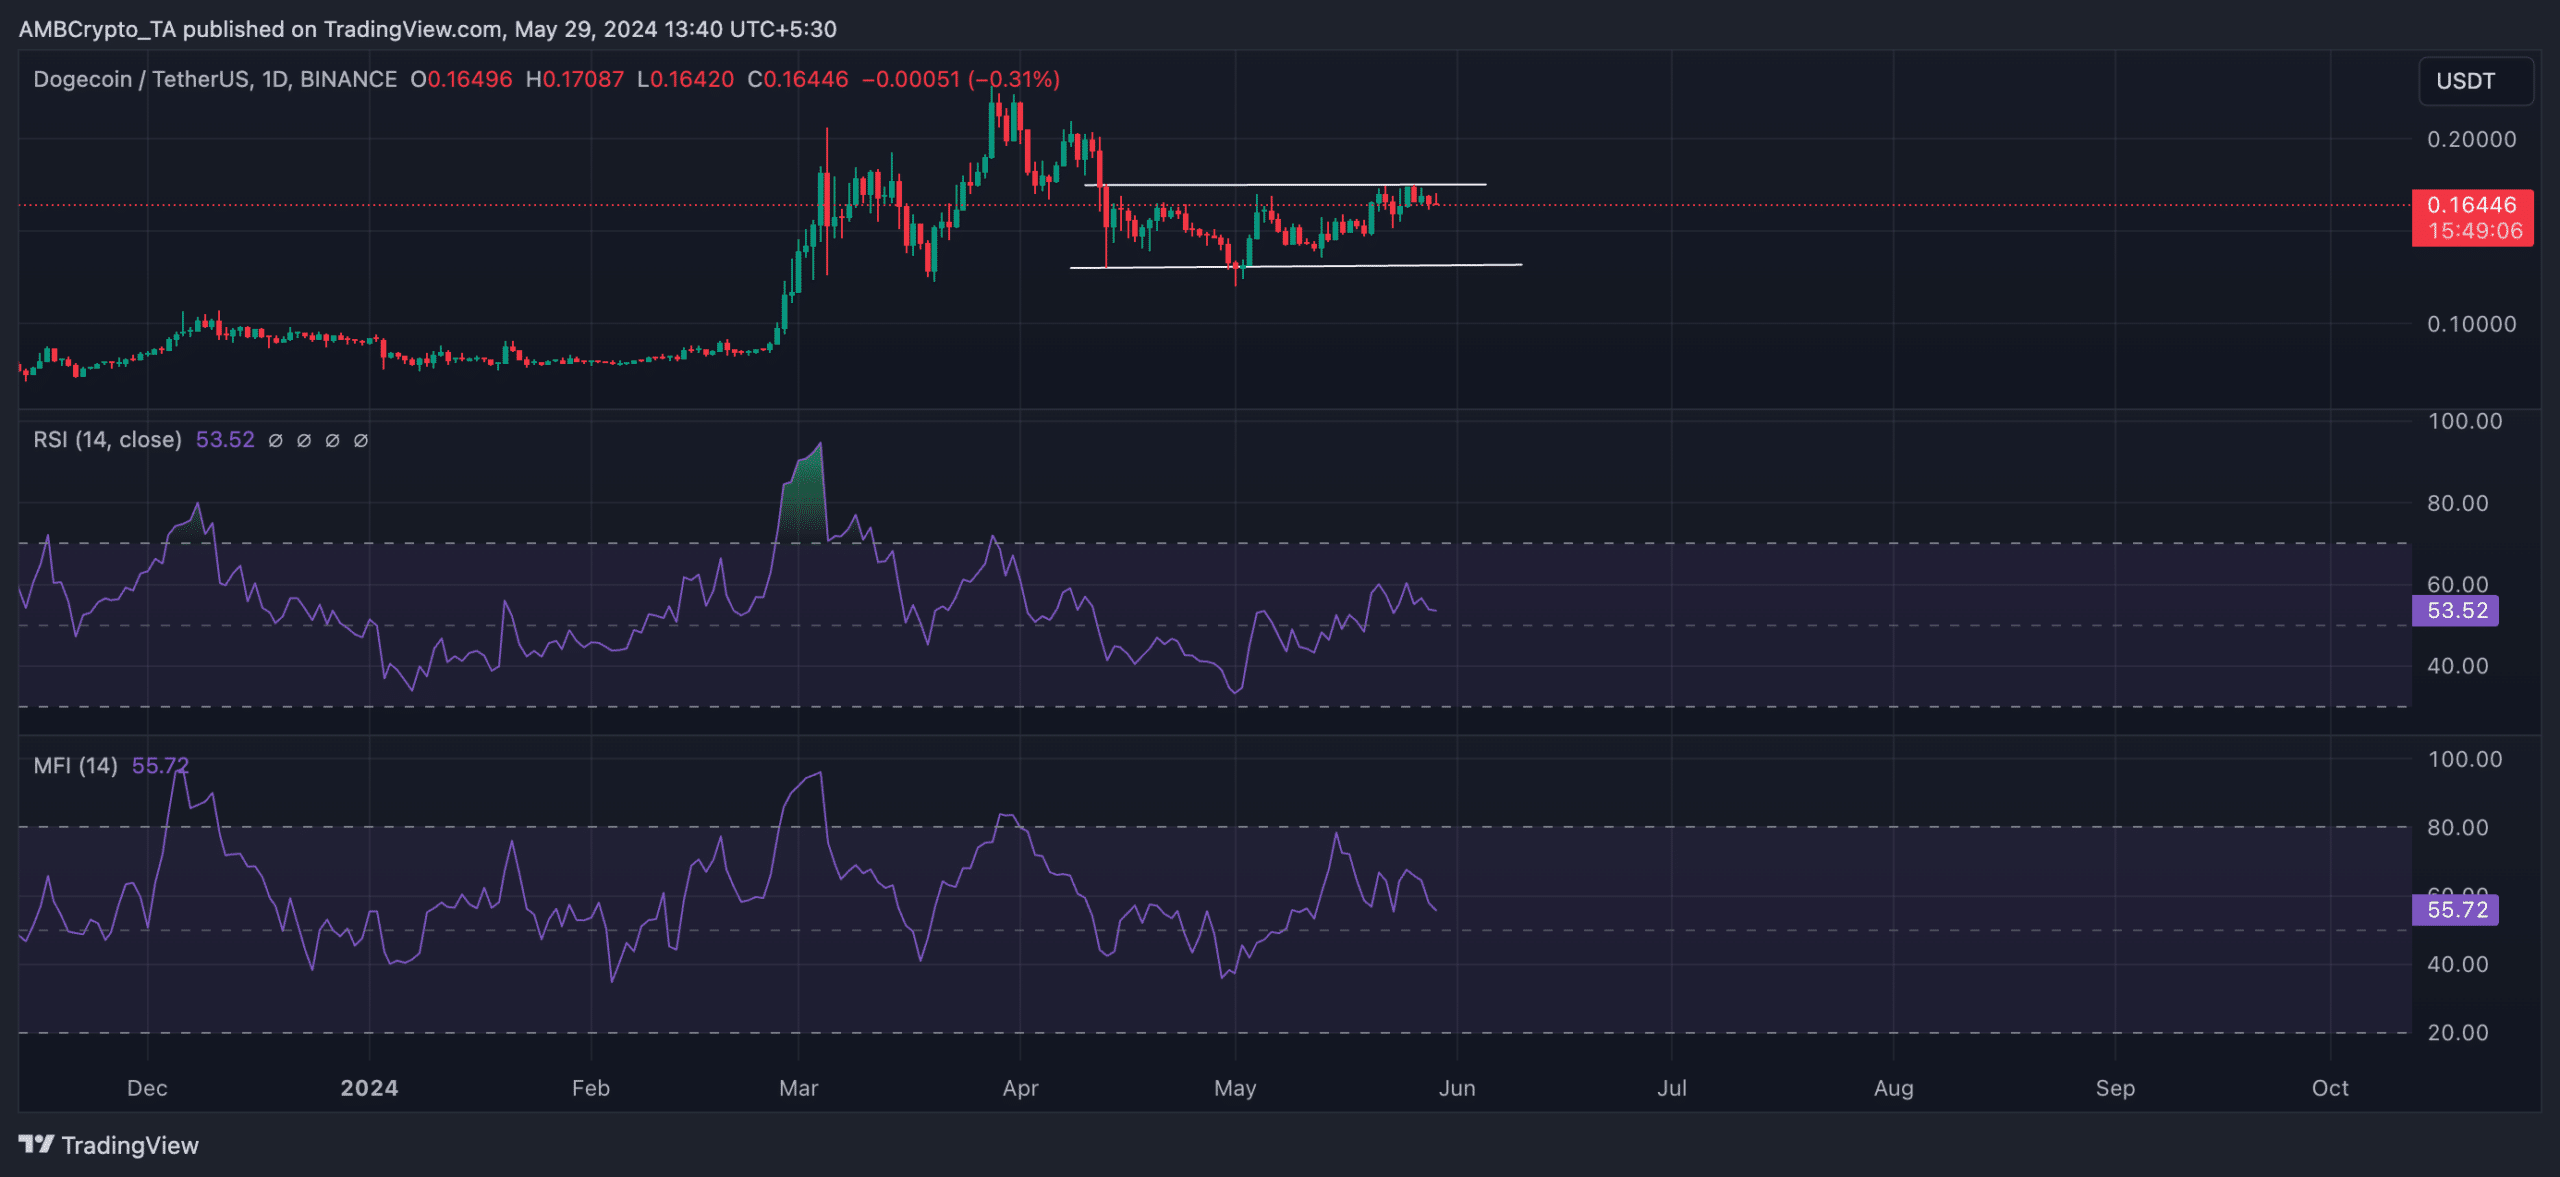
Source: DOGE/USDT on TradingView
Is your portfolio green? Check out the DOGE Profit Calculator
A combined reading of both indicators suggested that neither bulls (buyers) nor bears (sellers) were in firm control.
It meant there was a balance between buying and selling volume, and neither side had significant dominance.