


- Dogecoin still volatile, with most holders in profit despite a bearish long-term trend
- DOGE’s market behavior didn’t seem to have any clear directional movement
Dogecoin (DOGE), the blueprint for memecoins everywhere, has not been the greatest performer this cycle. However, it did make some modest gains a week ago amid the spot Ethereum ETF hype, seeing a hike of 8% in one day. At press time though, DOGE’s chart appears to be painted in red. Has the world’s largest meme crypto gone full bear?
First of all, let’s take a look at DOGE holders. Data from IntoTheBlock revealed that a large majority (83%) of DOGE holders are profitable at its current price. So, despite recent losses, long-term holders are still in a favorable position. Especially since 63% of Dogecoin’s supply is held by whales too.
Here, it’s worth looking at BTC too. The strong correlation (0.86) with Bitcoin is a sign that Dogecoin’s price movements are heavily influenced by the broader market trends, particularly the movements of Bitcoin.
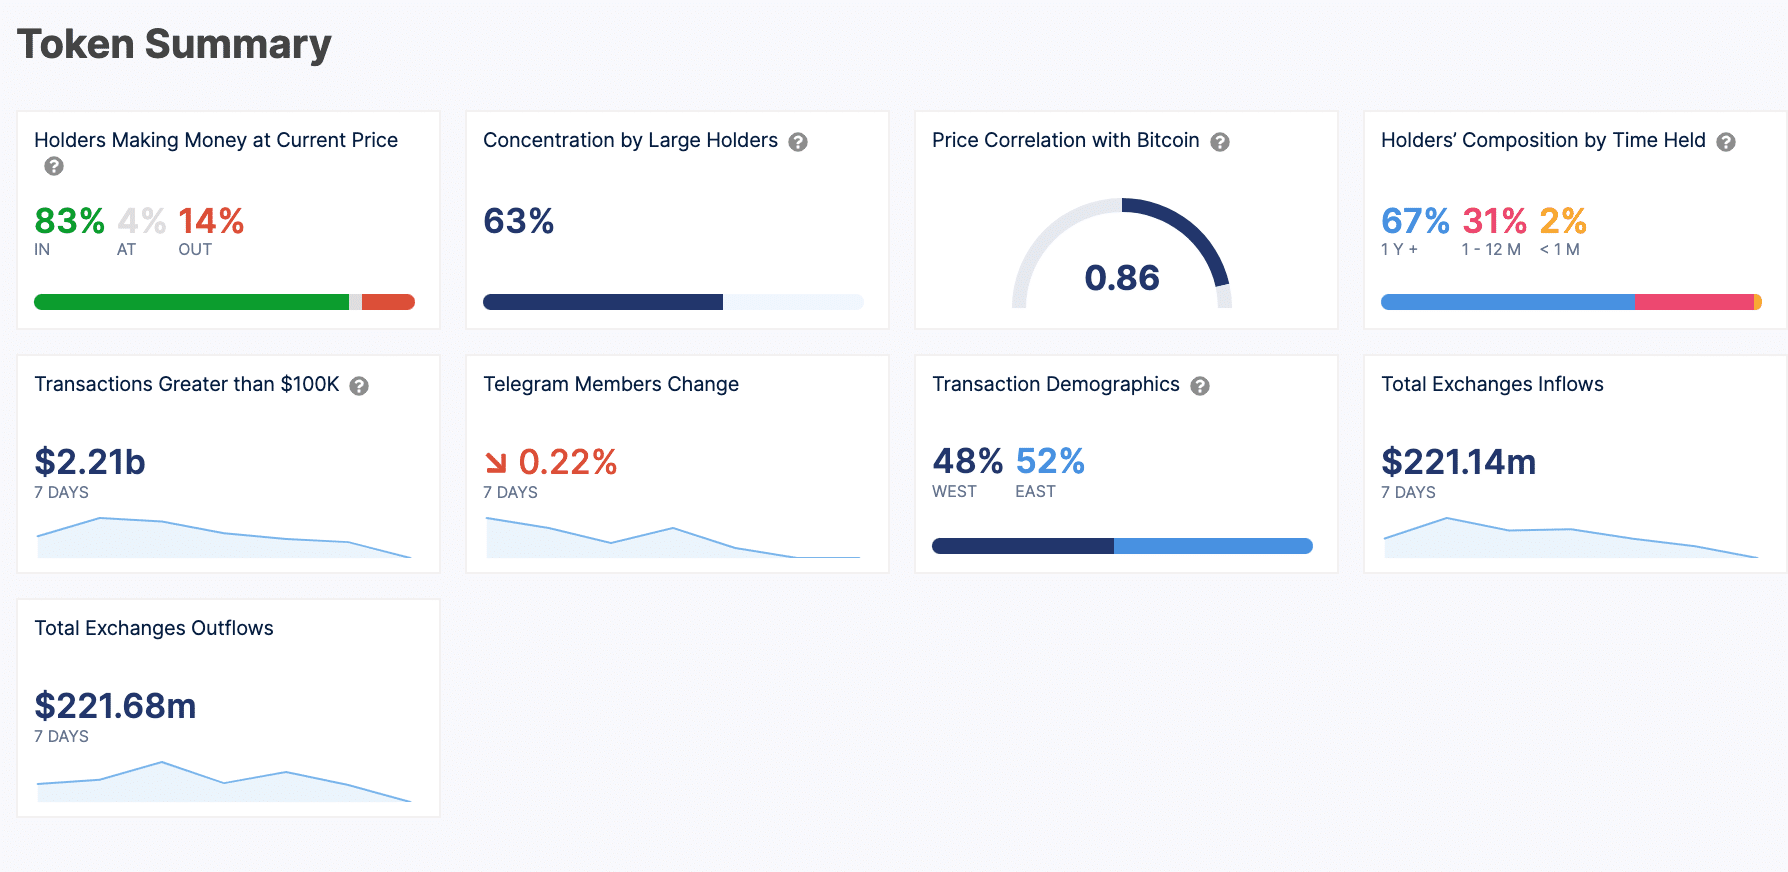
The near parity between inflows ($221.14 million) and outflows ($221.68 million) from exchanges over the past week could be a sign of a balanced buy-sell activity among traders. In fact, Dogecoin has consolidated its position since neither bulls nor bears have been taking the upper hand on the charts.
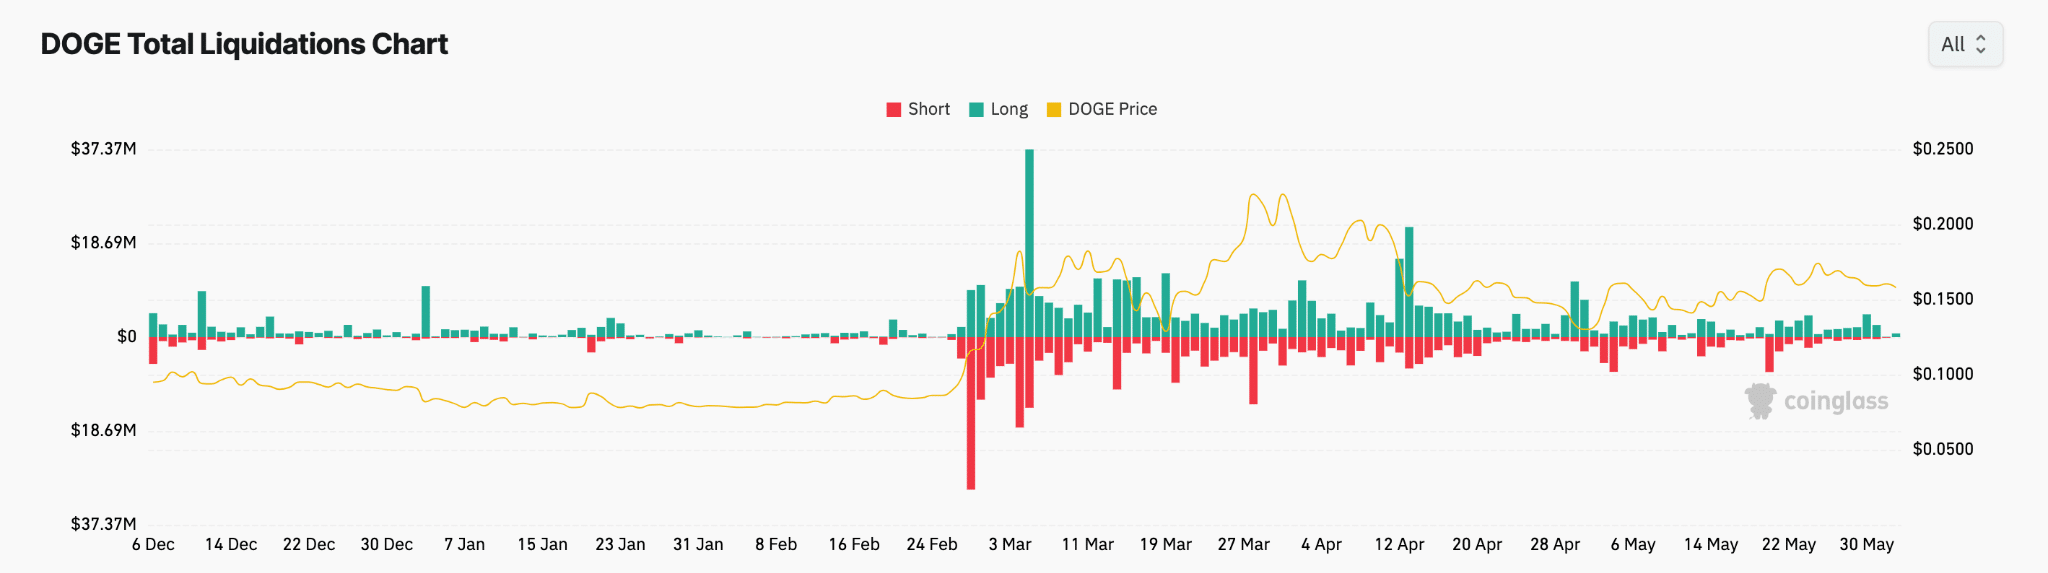
Dogecoin’s spikes, especially in short liquidations, correspond with abrupt price hikes, suggesting that rapid uptrends have forced short sellers to exit their positions at a loss.
The overall trend reveals a mixture of long and short liquidations without a sustained increase in either, pointing to a market characterized by speculative trading and sudden price shifts rather than a consistent directional movement.
This pattern of liquidation aligns with DOGE’s ongoing price performance too. Despite its resilience, the market remains uncertain, marked by short-lived rallies and corrections. Just like a typical memecoin.
Analyzing Dogecoin’s monthly chart revealed a cryptocurrency wrestling with volatility and market sentiment too. Throughout the past month, for instance, DOGE has exhibited a range of fluctuations, but primarily moved within a constrained price band from about $0.135 to $0.175.
The Relative Strength Index (RSI) oscillating between the 30s and 60s meant the memecoin has been in neutral to slightly bearish zones on the charts.
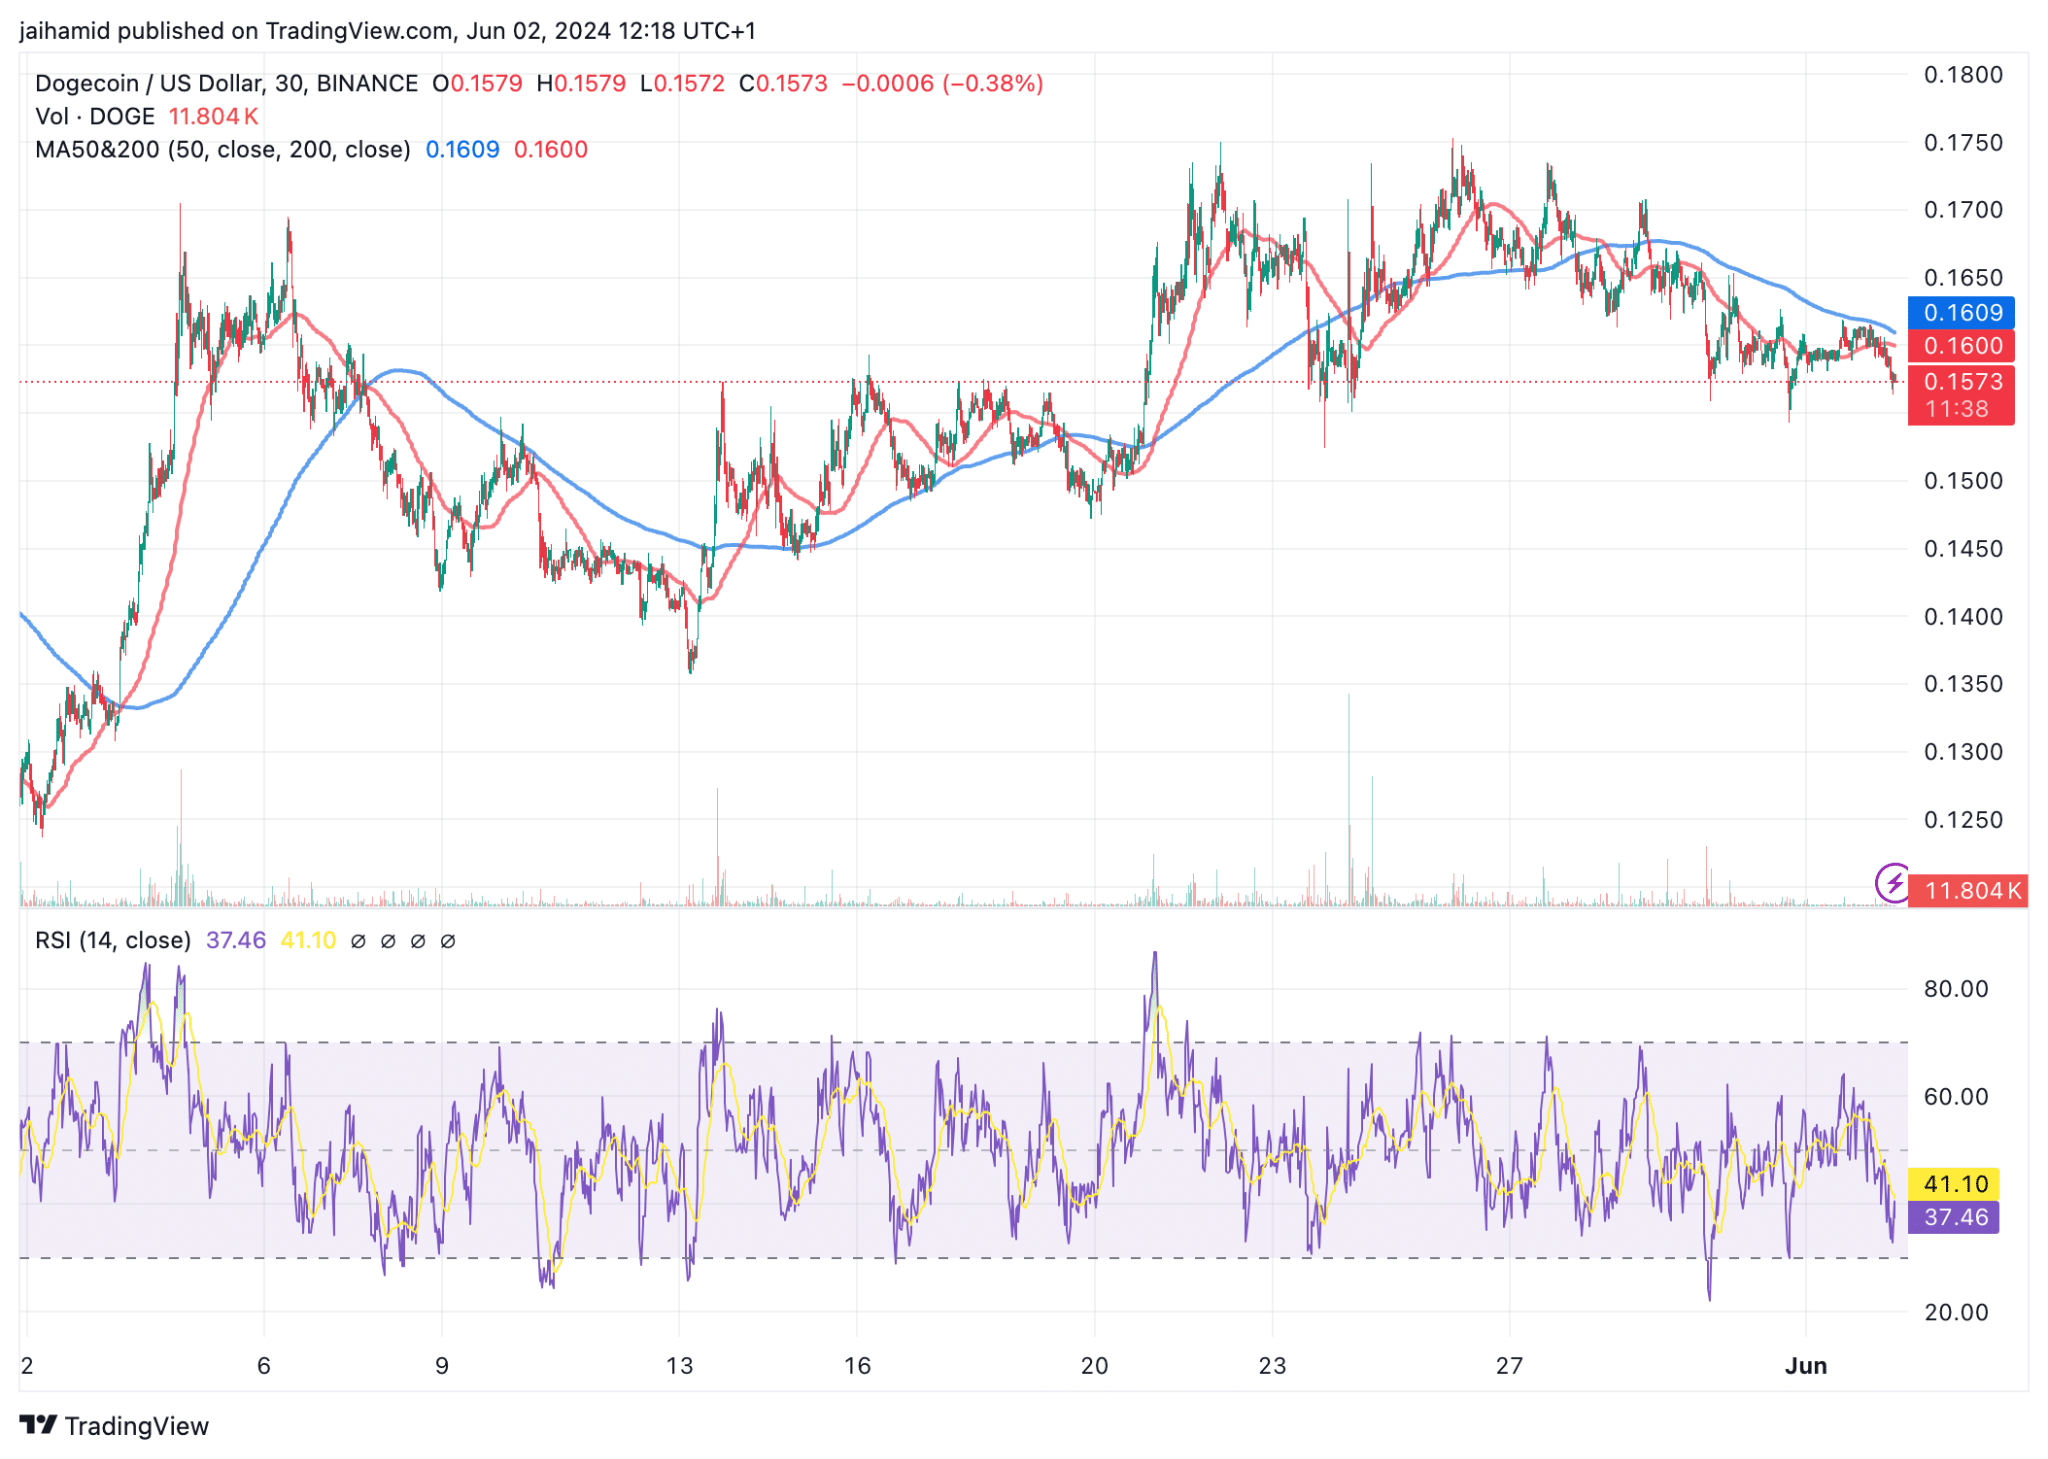
The moving averages seemed to share a clearer picture of the medium-term trend on DOGE’s chart. In fact, the 200-day moving average was found hovering above the 50-day for the most part – A sign that despite short-term recoveries, the broader outlook is still quite bearish for Dogecoin.