Dogecoin’s these two levels should be considered before making any move

Disclaimer: The findings of the following analysis are the sole opinions of the writer and should not be considered investment advice
Dogecoin has been on a relentless downtrend since November. While Bitcoin has also been on a downtrend since November, the time period from January to late March suggested that a bullish move was possible for BTC.
Dogecoin showed no such likelihood, as it toled beneath the $0.14 and $0.16 resistance levels in the same time period. Going forward, Dogecoin investors need to remember that the coin has a strongly bearish structure on the charts, and further losses could be seen in the weeks to come.
DOGE- 1 Day Chart
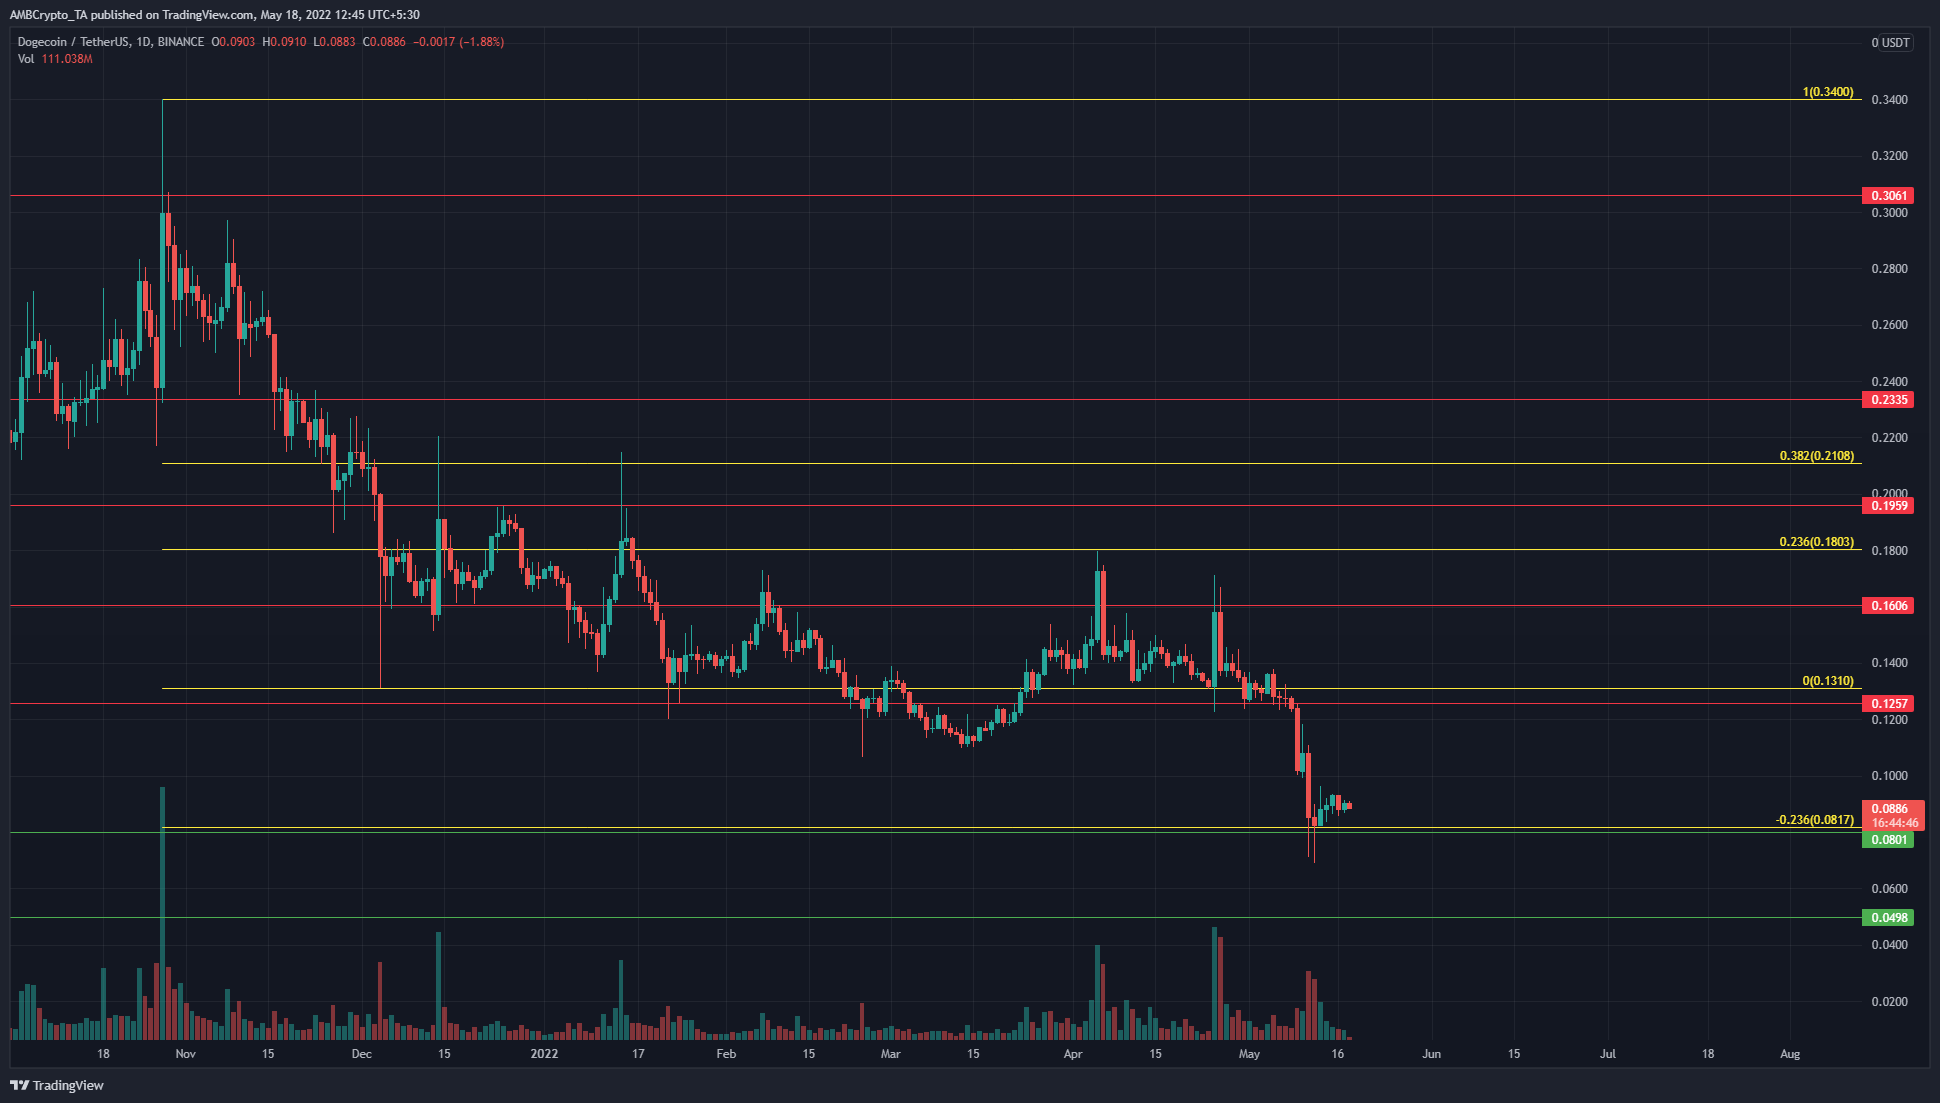
A set of Fibonacci retracement levels (yellow) was drawn based on DOGE’s drop from $0.34 to $0.131 during November and December. It can be seen that both the 38.2% and the 23.6% retracement levels at $0.21 and $0.18 respectively have acted as resistance in the past five months.
DOGE’s inability to climb past these two retracement levels showed that the trend was firmly pointed southward. Moreover, on each rejection, the daily candle had long upper wicks, which meant that buyers were exhausted in their attempts to drive prices higher.
In early May, the price fell below the $0.125 support and proceeded to drop another 35% before finding some temporary respite at the $0.08 support level. In the weeks to come, a revisit of the $0.12 area, or a daily session close below the $0.08 level, can both be used to enter a short position on DOGE.
Rationale
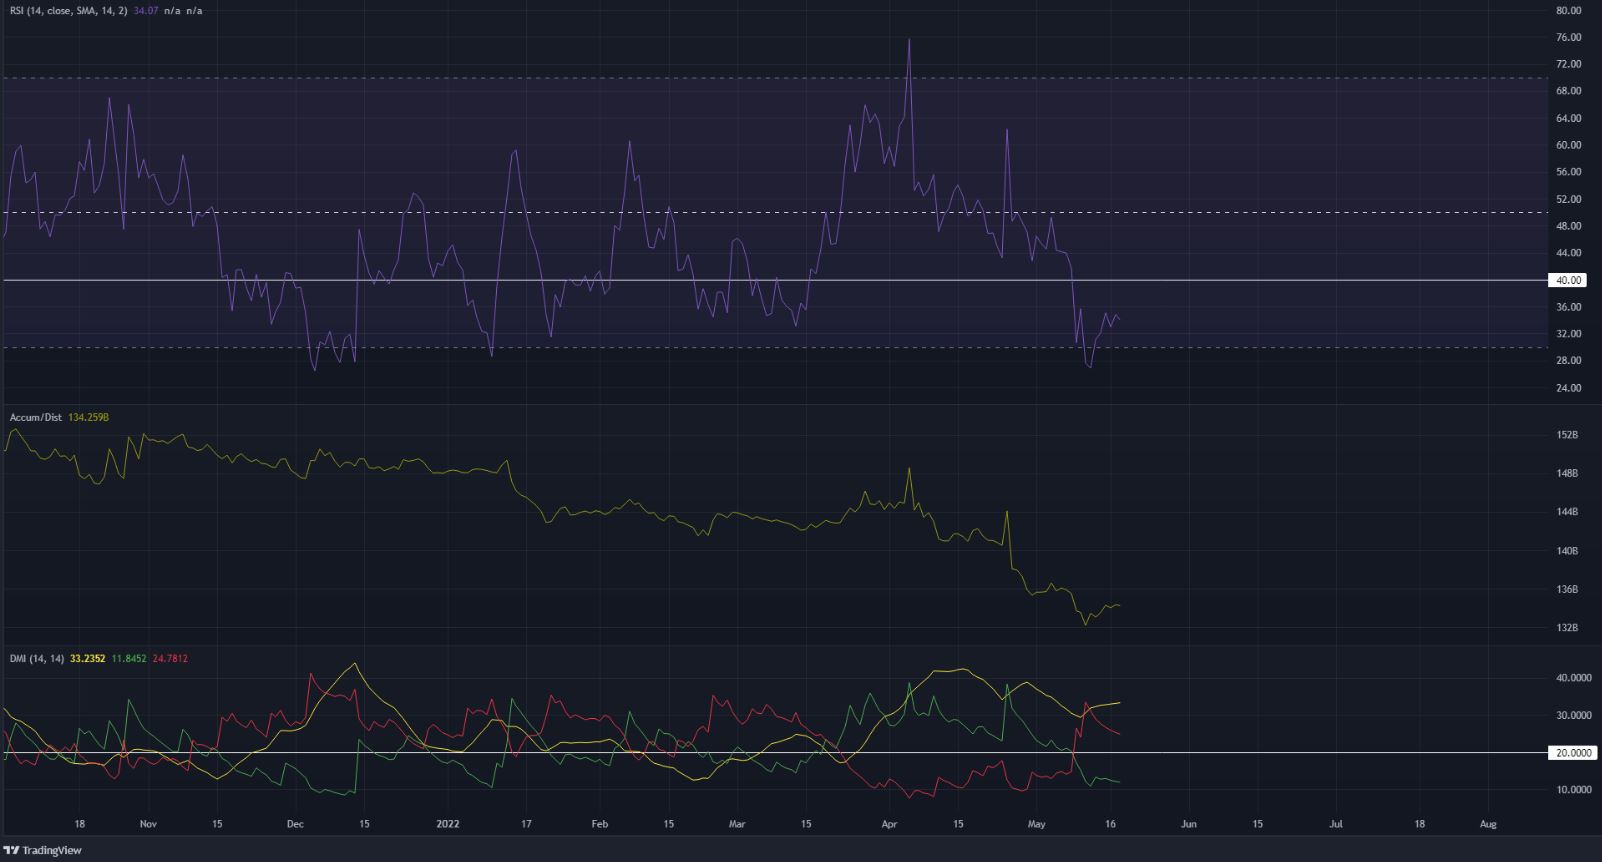
The RSI on the daily chart has been below the neutral 50 line for the best part of the past six months, with an exception being the mid-March rally. At the time of writing, the RSI was at 34 to show strong bearish momentum, and the 40 mark on this indicator could have some importance in the days to come. A session close above 40 would signal a weakening bearish pressure.
The A/D indicator dived lower on the charts in response to the multiple waves of selling in 2022, and significant demand simply wasn’t yet visible which would suggest a trend reversal. The Directional Movement Indicator also showed a strong bearish trend in progress in May, as the -DI (red) and the ADX (yellow) both rose above the 20 mark.
Conclusion
The indicators remained firmly in favor of the bears, and a session close below $0.08 would likely see Dogecoin drop toward the $0.05 support area. Alternatively, a revisit to the $0.11-$0.12 area could also offer opportunities to sell DOGE.