
Here’s why Ethereum could hit $4.9K before retail FOMO starts

- DOT showed signs of bottoming out, with a potential breakout from the descending channel targeting $7
- Momentum seemed to be building, with whale accumulation seen too
Polkadot [DOT] is again in the spotlight today after the token appeared to be finding its bottom after a prolonged downtrend on the charts.
Crypto analyst Captain Faibik recently suggested on X (formerly Twitter) that DOT may be primed for a major rebound, with a bullish rally expected in Q4. His analysis pointed to significant signs of accumulation – A sign that DOT may be gearing up for a major move north.
At press time, DOT was trading at $4.32, up 2.27% in the last 24 hours. Now, this suggested there may be potential for a breakout, but how valid is this outlook?
A key technical setup – Breaking out of the downtrend
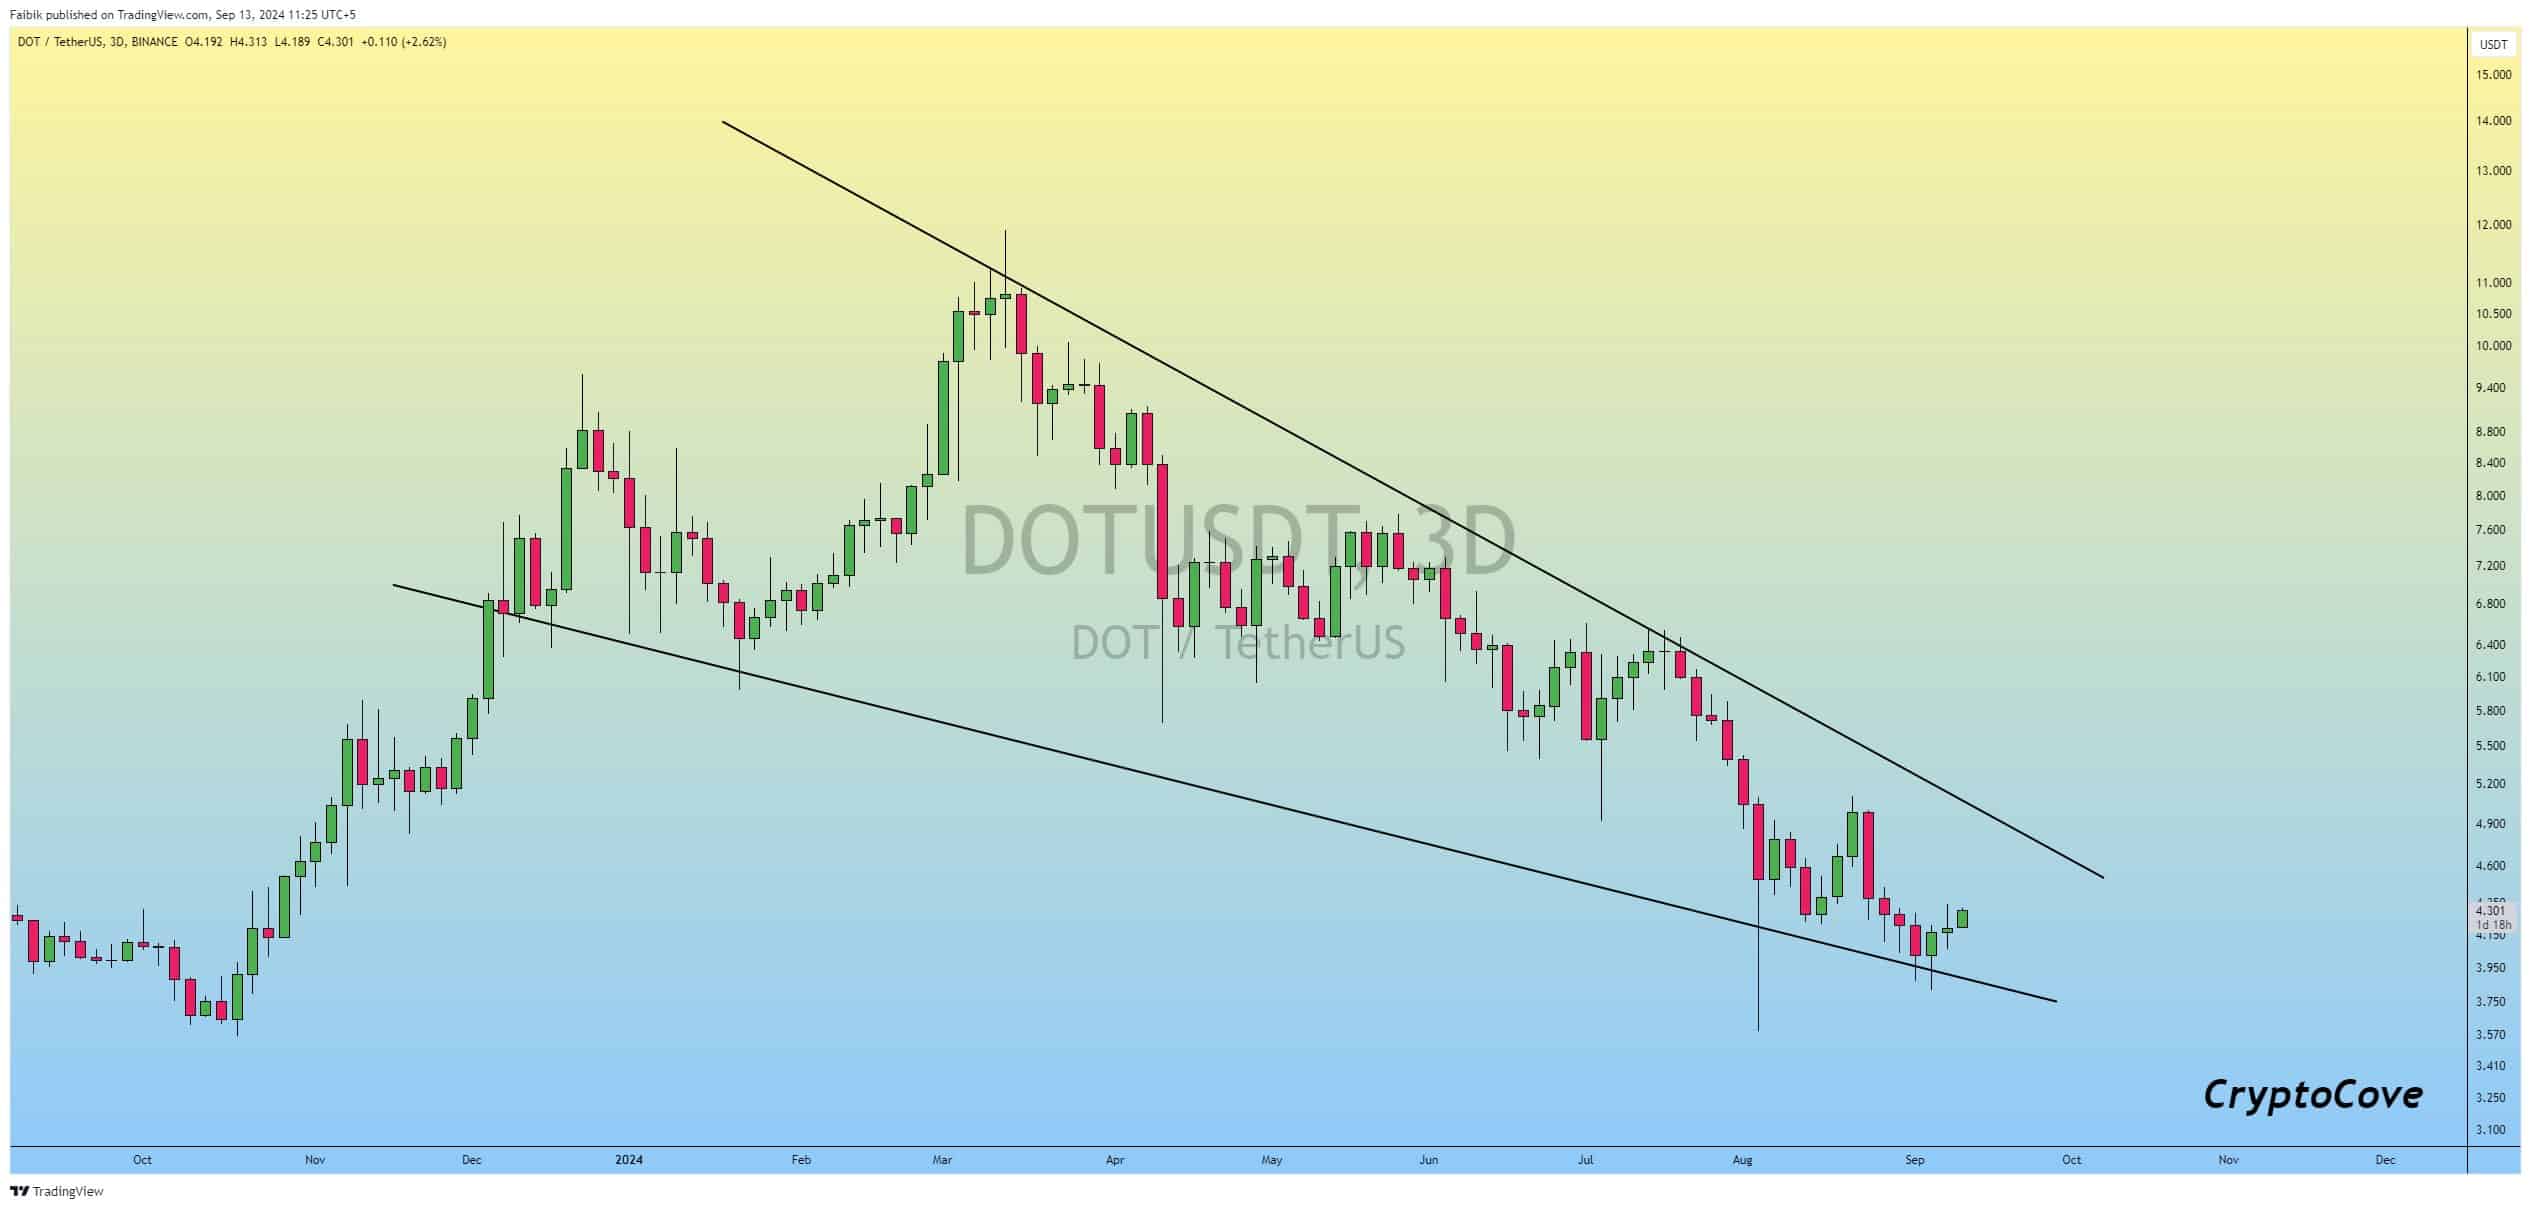
DOT’s price has been trapped in a descending channel since early 2024, with the altcoin steadily losing its value. However, recent charts show that the token is now bouncing off its lower support line at $4.19. The descending channel is a pattern that, when broken to the upside, typically signals a trend reversal and renewed bullish momentum.
The aforementioned analysis also revealed that DOT may have already established a bottom around $4. This provides a solid base for further accumulation. If DOT breaks out of this channel, the next key resistance levels would lie between $5 and $6, with potential upside targets as high as $7 in Q4.
Source: X
On-chain activity: Whale accumulation is rising
On-chain data indicated that whales have been actively accumulating DOT – A sign of great confidence in the asset’s long-term performance. The circulating supply of DOT stood at 1.492 billion, with the altcoin having a market cap of $6.44 billion.
Additionally, $86.22 million in 24-hour volumes pointed to steady liquidity despite recent market turbulence. Liquidations also showed $48.69k in shorts being cleared, hinting at a possible short squeeze.
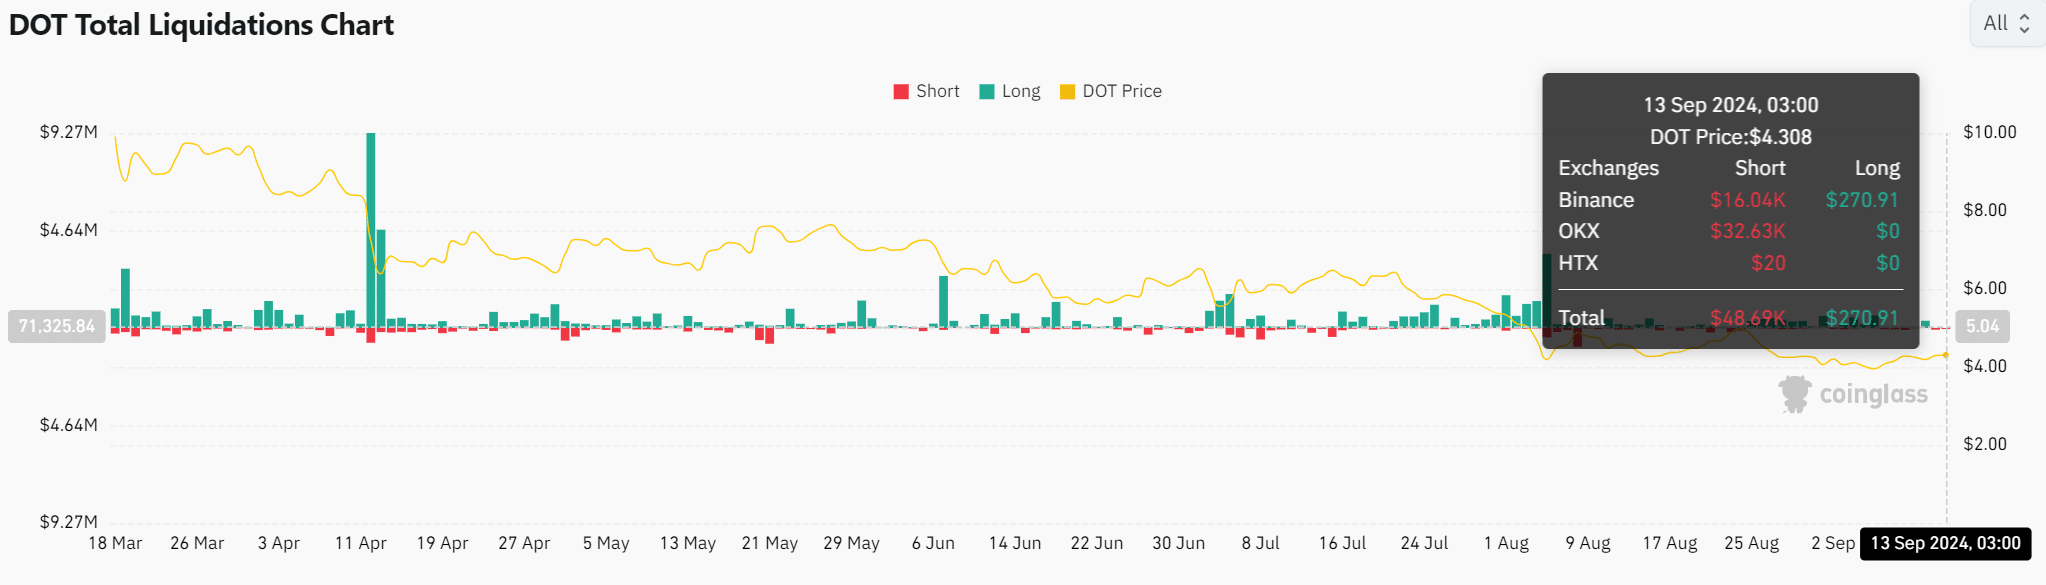
Source: Coinglass
Technical indicators – Is momentum gaining strength?
At press time, the Relative Strength Index (RSI) had improved, moving from oversold territory to 60.81 – A sign that upward momentum may be building.
Furthermore, the Bollinger Bands (BB) revealed that DOT may be testing its upper band at $4.33. This often signifies growing buying pressure on the charts. If the price continues to hug the upper band, it could indicate an impending breakout.
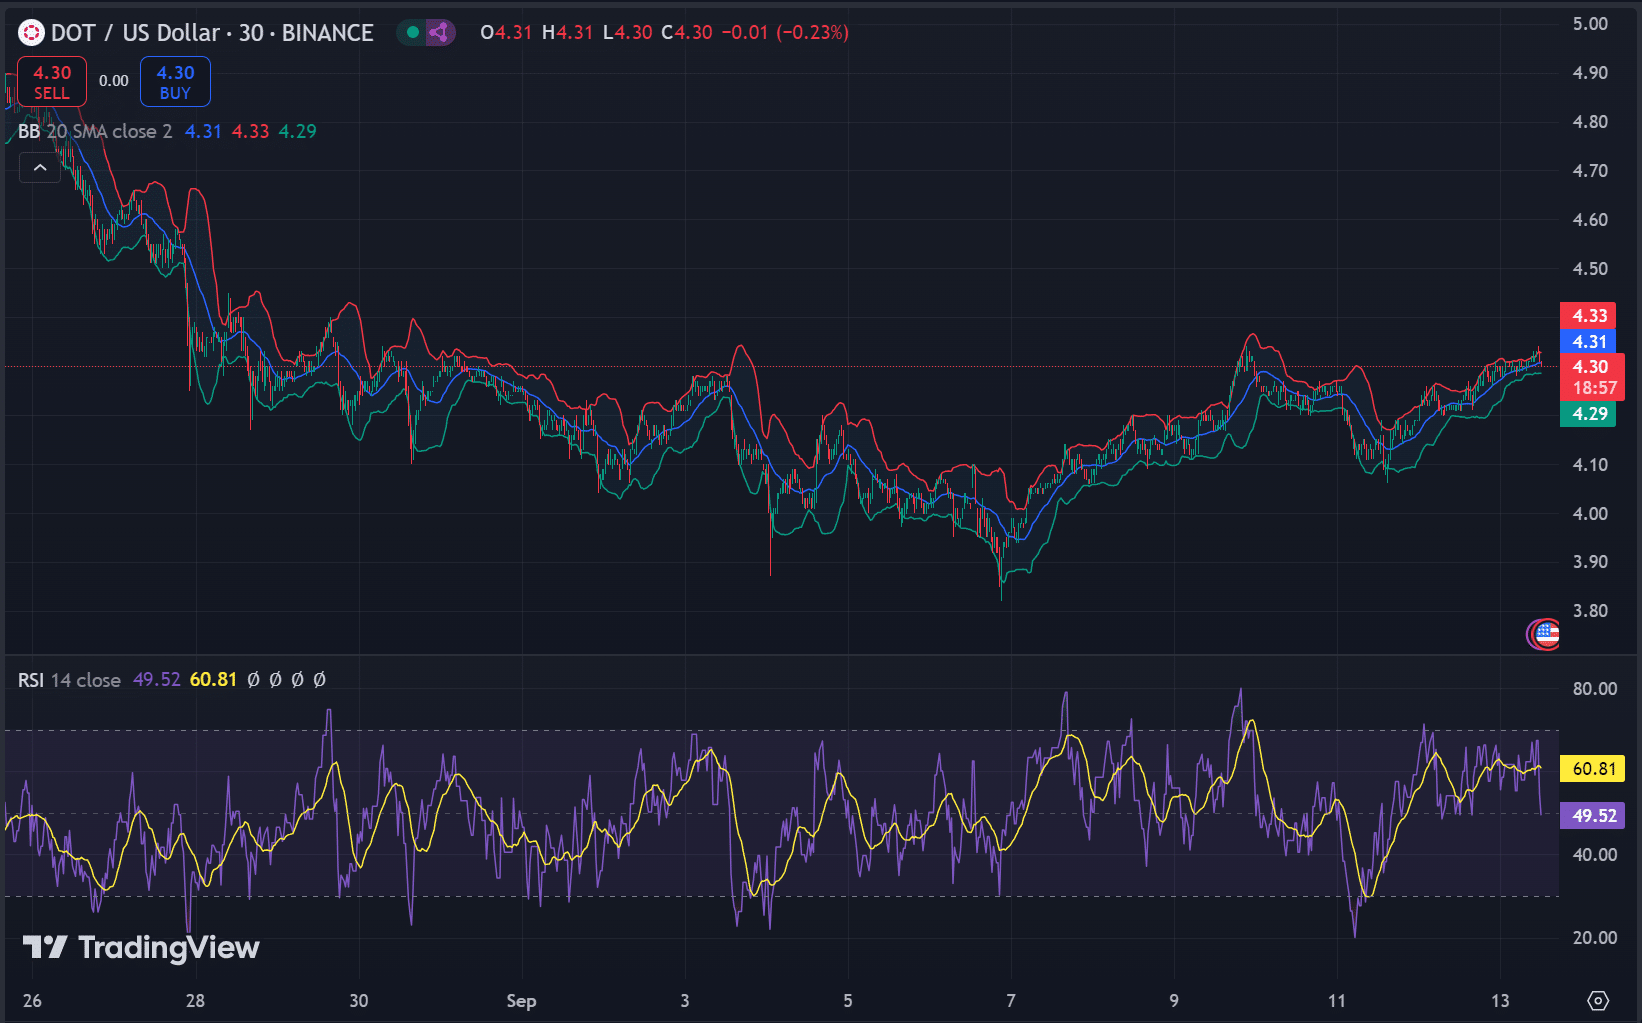
Source: TradingView
Is DOT ready for a bullish Q4?
With its technical setup improving and whale accumulation rising, DOT appears well-positioned for a potential breakout in Q4.
A move beyond the key resistance levels of $5 to $6 could push the price higher, potentially reaching $7, as suggested by historical patterns. However, confirmation of the breakout remains essential to solidifying this bullish outlook.


