
- The 1-day and 4-hour price structures both showed bullishness.
- A 10% price bounce appeared imminent, based on the liquidation heatmap.
The weekend was kind to EOS [EOS]. On the 12th of April, EOS rallied 13.68% from $0.619 to $0.704. Two weeks earlier, it managed to break the bearish daily market structure by blasting past the $0.641 resistance (red).
At press time, EOS bulls were battling to defend the $0.64 region as support. They appear to have succeeded, based on the evidence at hand.
The market sentiment was still slightly fearful, and Bitcoin [BTC] would influence whether EOS could continue the recovery.
EOS bulls defend the $0.65 demand zone and seek to push higher
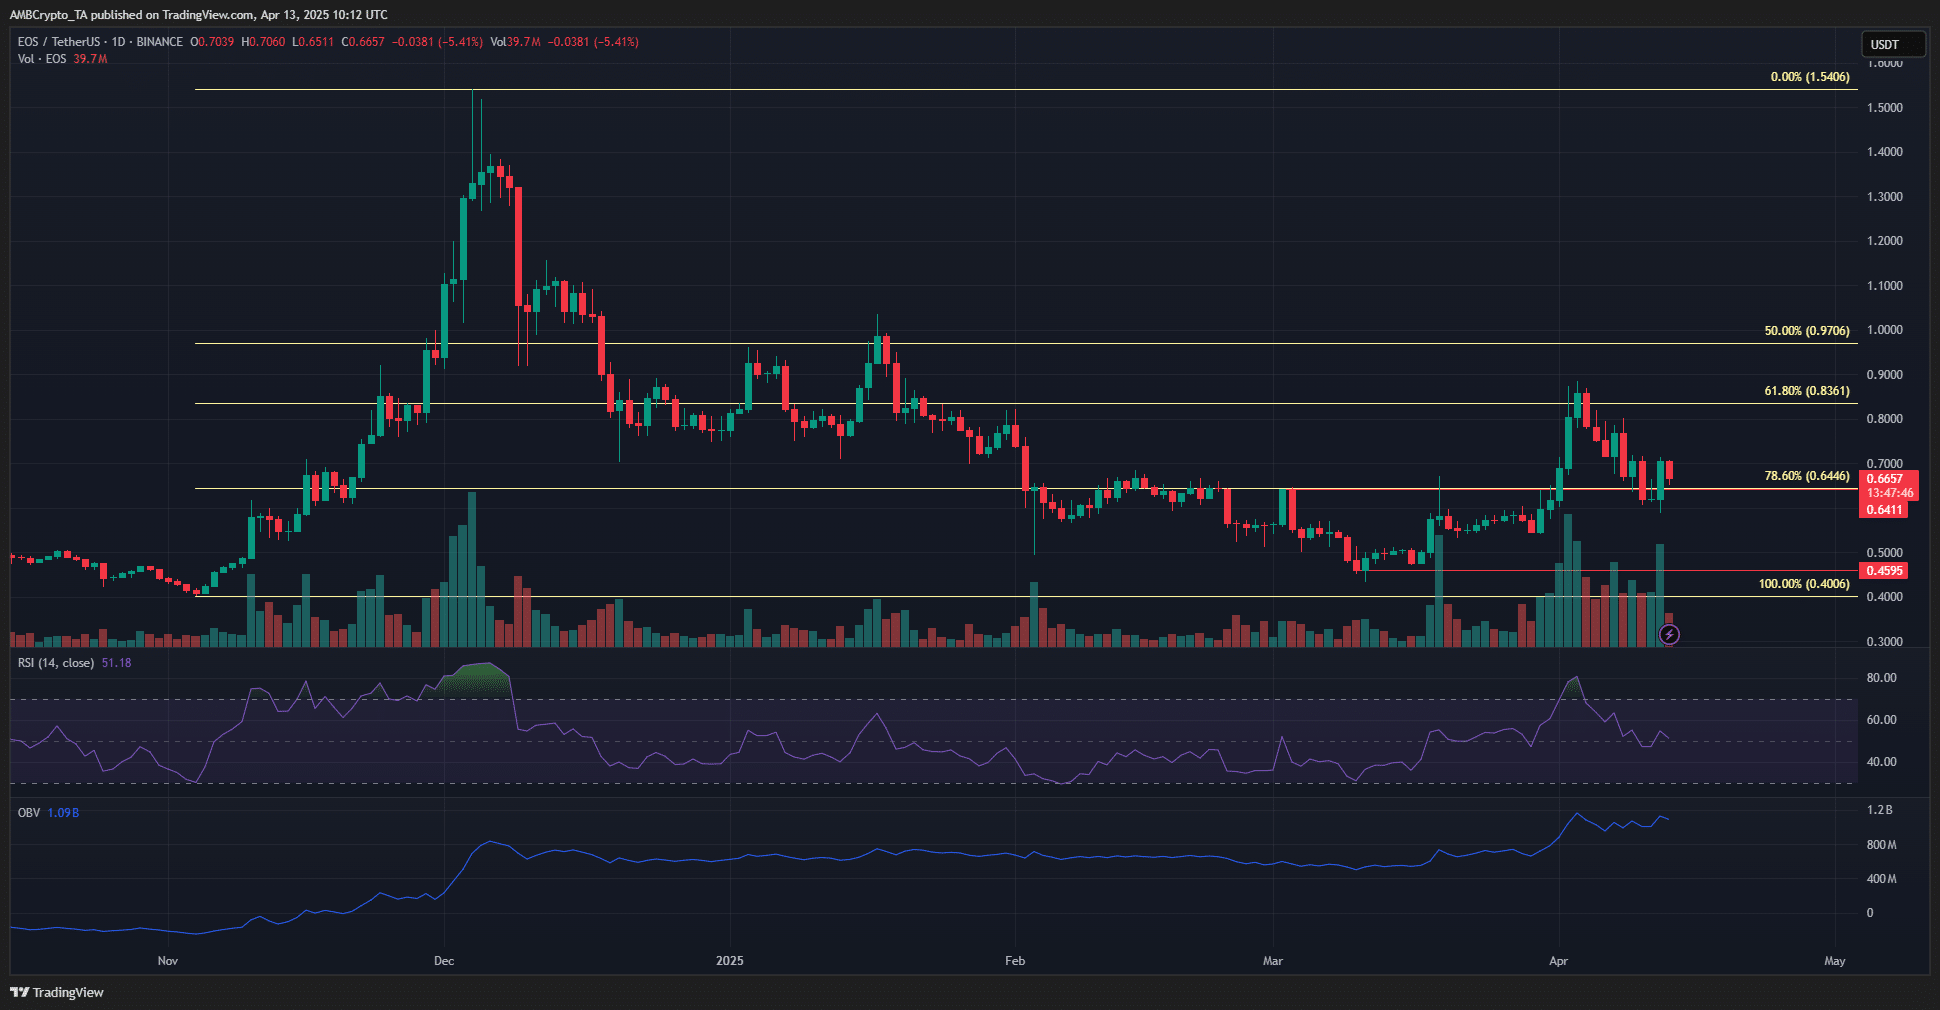
Source: EOS/USDT on TradingView
The bullish market structure break on the 1-day chart came toward the end of March, when prices rocketed past $0.641. Since then, a higher high at $0.884 and a higher low at $0.588 have been set.
Hence, investors can have a bullish outlook for EOS. The 90-day tariff pause announcement by the US was not enough to clear up the uncertainty in the wider market, and EOS bulls must tint their bullishness with caution.
The OBV was in an uptrend in recent weeks, and the RSI remained above neutral 50. Together, the indicators and the price structure showed reasons to be bullish.
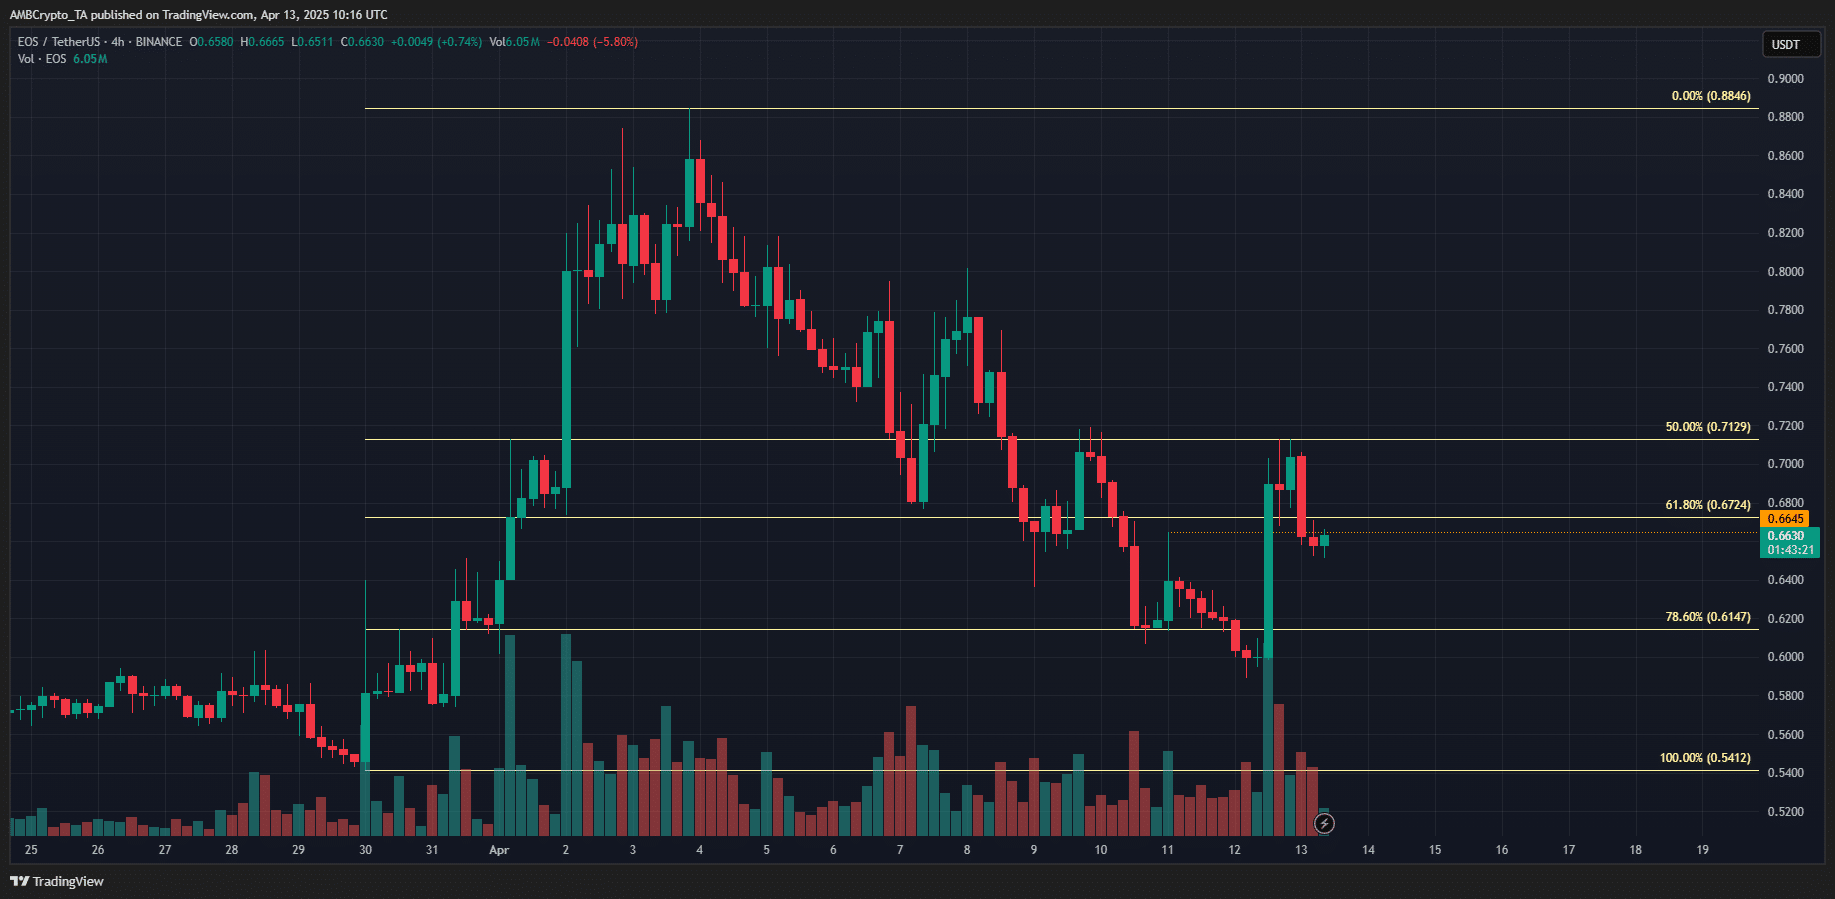
Source: EOS/USDT on TradingView
The 4-hour chart reinforced this view. It, too, has a bullish structure after Saturday’s rally took it beyond the lower high at $0.6645.
Additionally, based on the retracement in April, a set of Fibonacci retracement levels were plotted. They showed that the 78.6% level at $0.614 was tested before the bullish reversal.
This was another bullish signal on the lower timeframes. The $0.71 area has rebuffed the bears, but a move higher appeared likely.
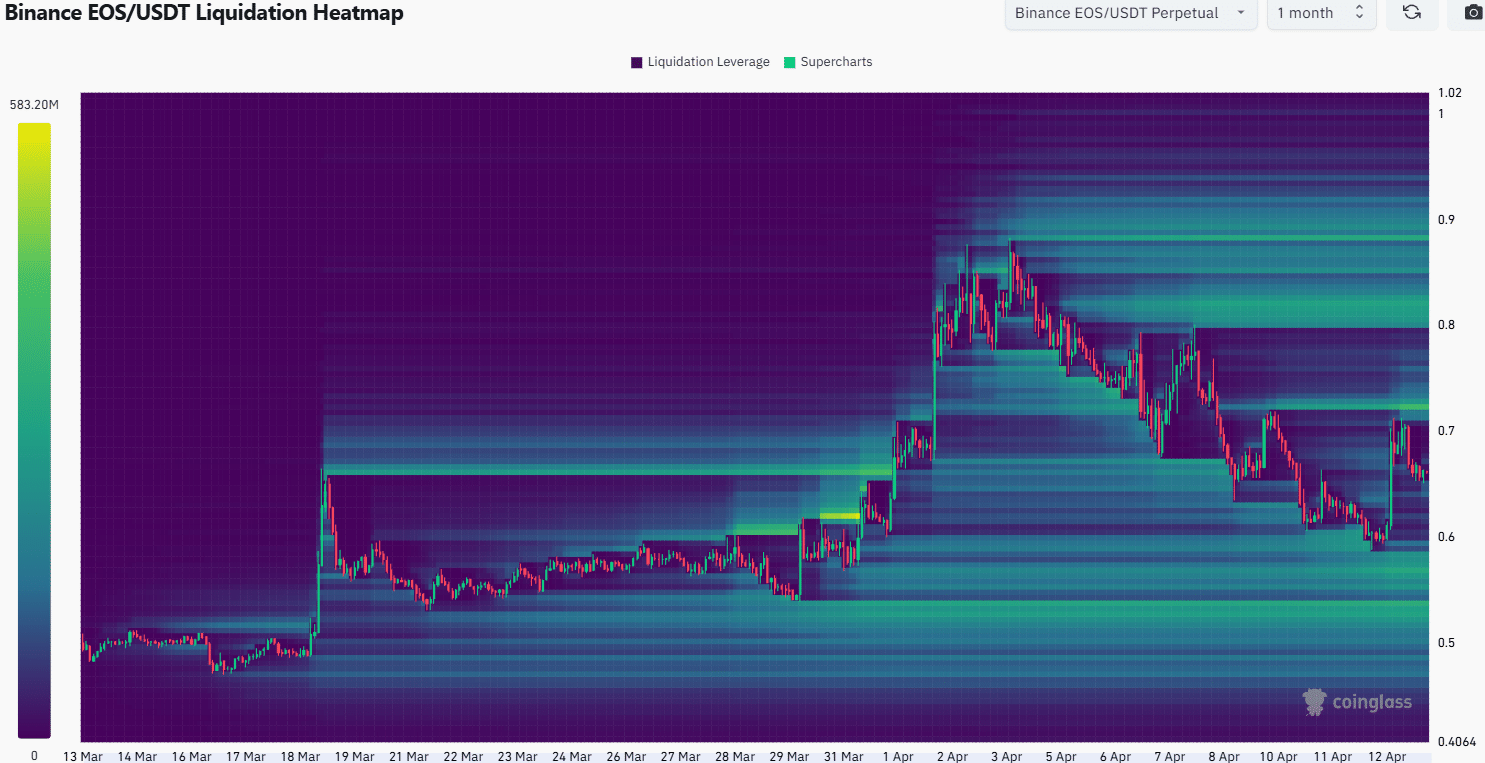
Source: Coinglass
The 1-month liquidation heatmap highlighted the $0.72 and $0.8 regions as the nearby magnetic zones of interest. There was some liquidity built up at $0.63-$0.64 that could be tested in the coming hours.
Given the H4 bullish structure, it appeared likely that a move to $0.72 was imminent. If BTC can maintain its upward momentum, EOS could extend its gains and reach the $0.8 resistance over the coming week.
Disclaimer: The information presented does not constitute financial, investment, trading, or other types of advice and is solely the writer’s opinion