EOS long-term Price Analysis: 11 December

Disclaimer: The findings of the following article are the sole opinion of the writer and should not be taken as investment advice
It has been the same old story for EOS. After registering a high of $4.01 on 24 November, it has been a period of consistent decline for the crypto-asset. The cryptocurrency’s valuation at press time had fallen under the $3-range and after the latest meltdown, it was unlikely to rally again any time soon.
EOS registered a decline of 1.82% over the past 24-hours, but its long-term analysis predicted further periods of drawdown in the near future.
EOS 1-day chart
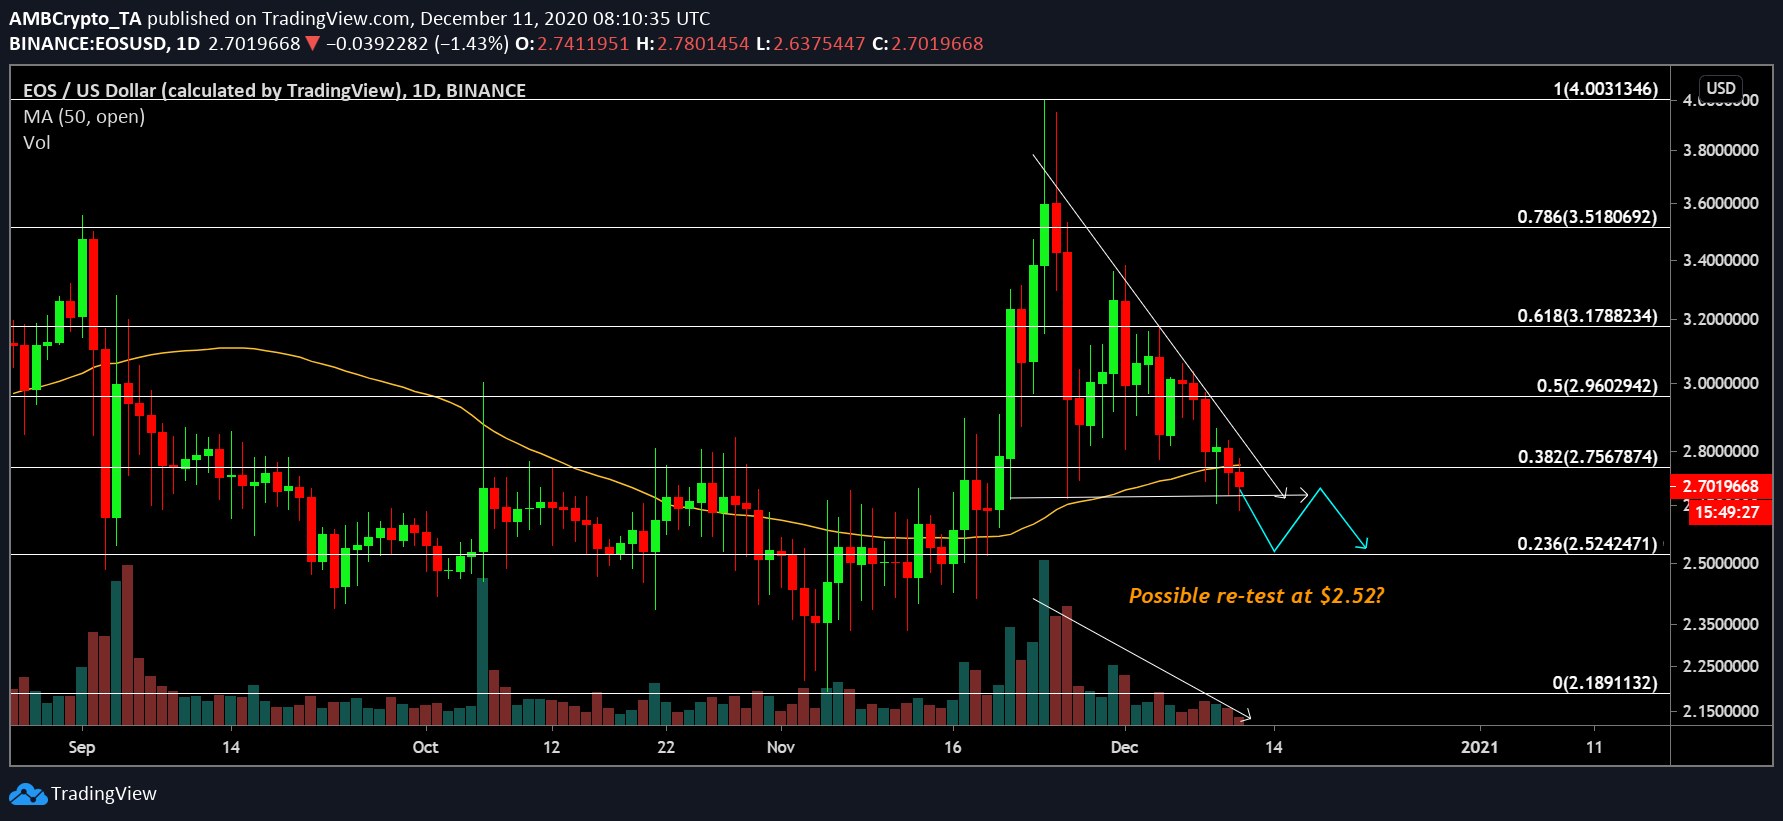
The aforementioned price rise on 24 November was a flash hike for EOS as it rose to $4.01, with the same lasting only for a brief period. The decline followed within the next 24-hours, but the asset was able to pull back yet again. Now, over the last 2 weeks, the asset has been oscillating under a descending triangle, a development that pointed to another bearish breakout in the future. While the descending triangle is a major indicator, the reversal of the 50-Moving Average seemed to be a significant sign.
After turning into underlying support on 19 November, the 50-MA flipped the trend yesterday, shifting as an overhead resistance at the time of writing. The price will face further selling pressure and the chances of another bearish breakout might increase on the chart.
The trading volume of EOS has already fallen dramatically over the last two weeks, indicative of low activity.
Market Reasoning
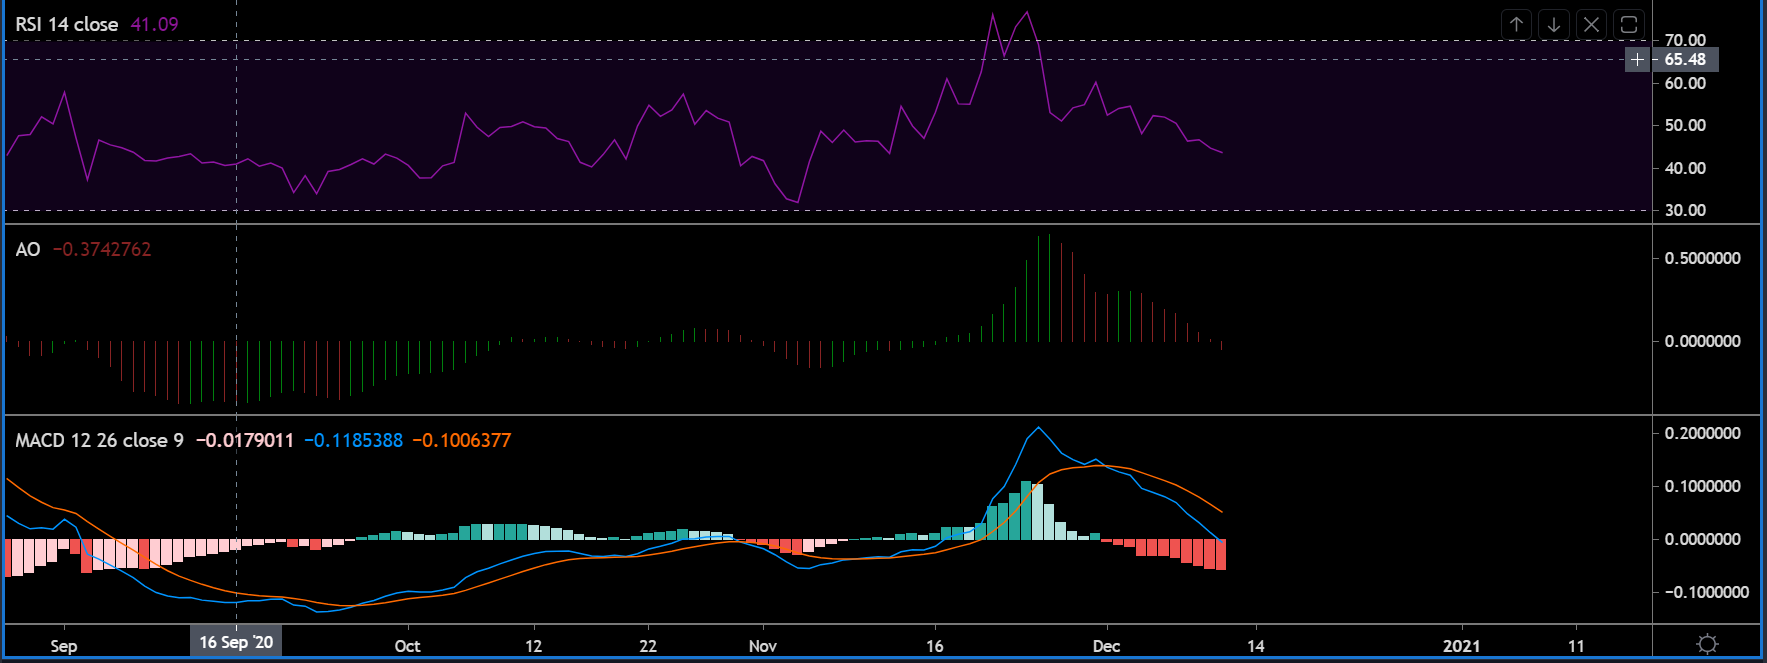
The market’s bears have managed to keep a stronghold on the market’s indicators as well. While the Relative Strength Index or RSI pointed to increasing sell pressure on the chart, the Awesome Oscillator remained neutral at press time. However, a set of rising red candles implied increasing bearish momentum.
Finally, the MACD remained completely bearish as the Signal line maintained its position above the MACD line on the charts.
Important Ranges
Resistance: $2.75, $2.96, $3.10
Support: $2.52, $2.20
Conclusion
EOS’s price seemed to possibly re-test the support at $2.52 after its eventual breakout from the descending triangle. With the Moving Average turning bearish, EOS will face an uphill battle to regain its position above $4.01 in the near future.