ETC: Dollar-cost averaging can be used to enter long all the way down to…

Disclaimer: The information presented does not constitute financial, investment, trading, or other types of advice and is solely the opinion of the writer.
Over the past month, Bitcoin [BTC] has formed a range between $22.6k and $18.8k, with some heavy resistance at $21.8k as well. The rest of the altcoin market also formed a range. Ethereum Classic [ETC] was one of these coins. It offered a relatively low-risk buying opportunity to enter at the range lows.
ETC- 12-Hour Chart
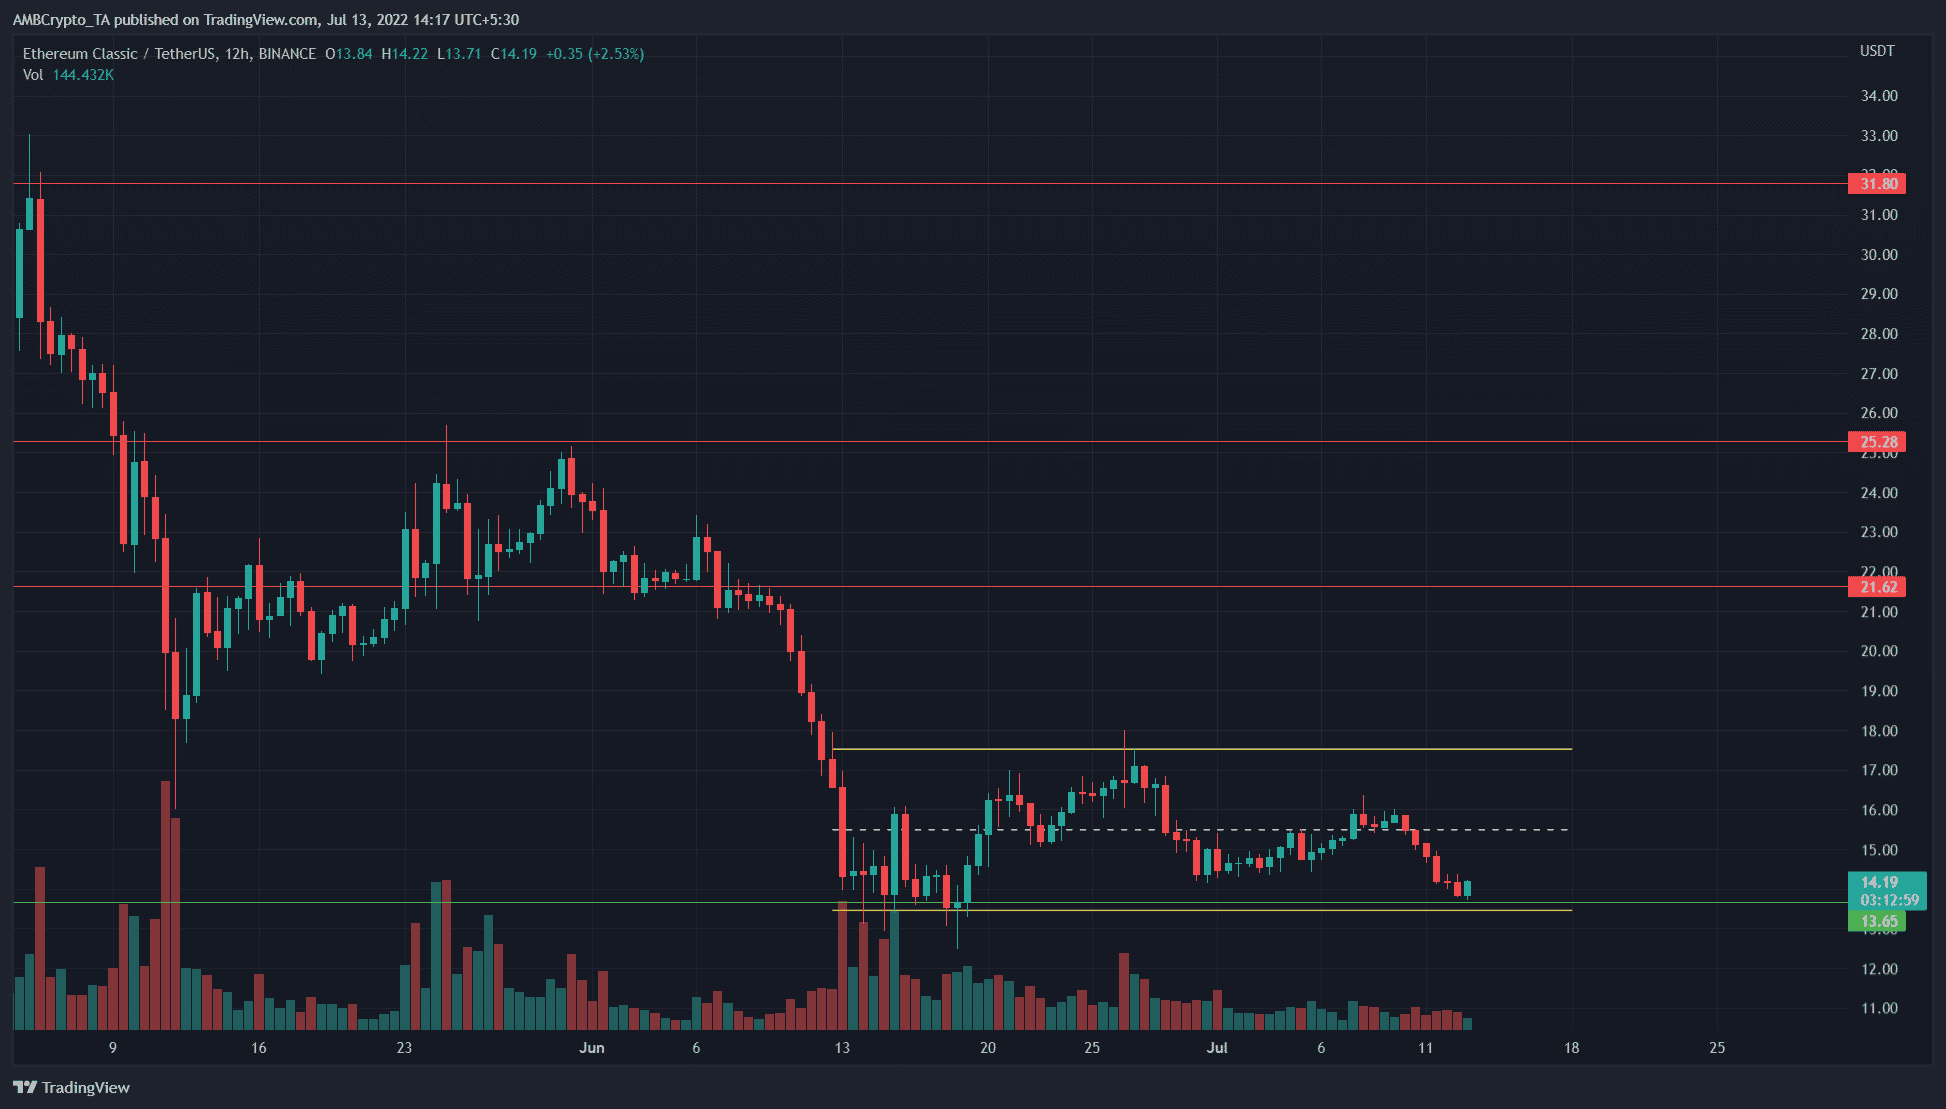
ETC formed a range from $13.55 to $17.55. The mid-point of the range lay at $15.5, and over the past month, this level has been respected as both a support and a resistance level.
Before June, Ethereum Classic had been in a downtrend stretching back to early April. The market structure remained bearish, as none of the significant lower highs have yet been broken. On the contrary, a level of support from the mid-May crash was retested in the recent bounce to $17.5.
ETC- 4-Hour Chart
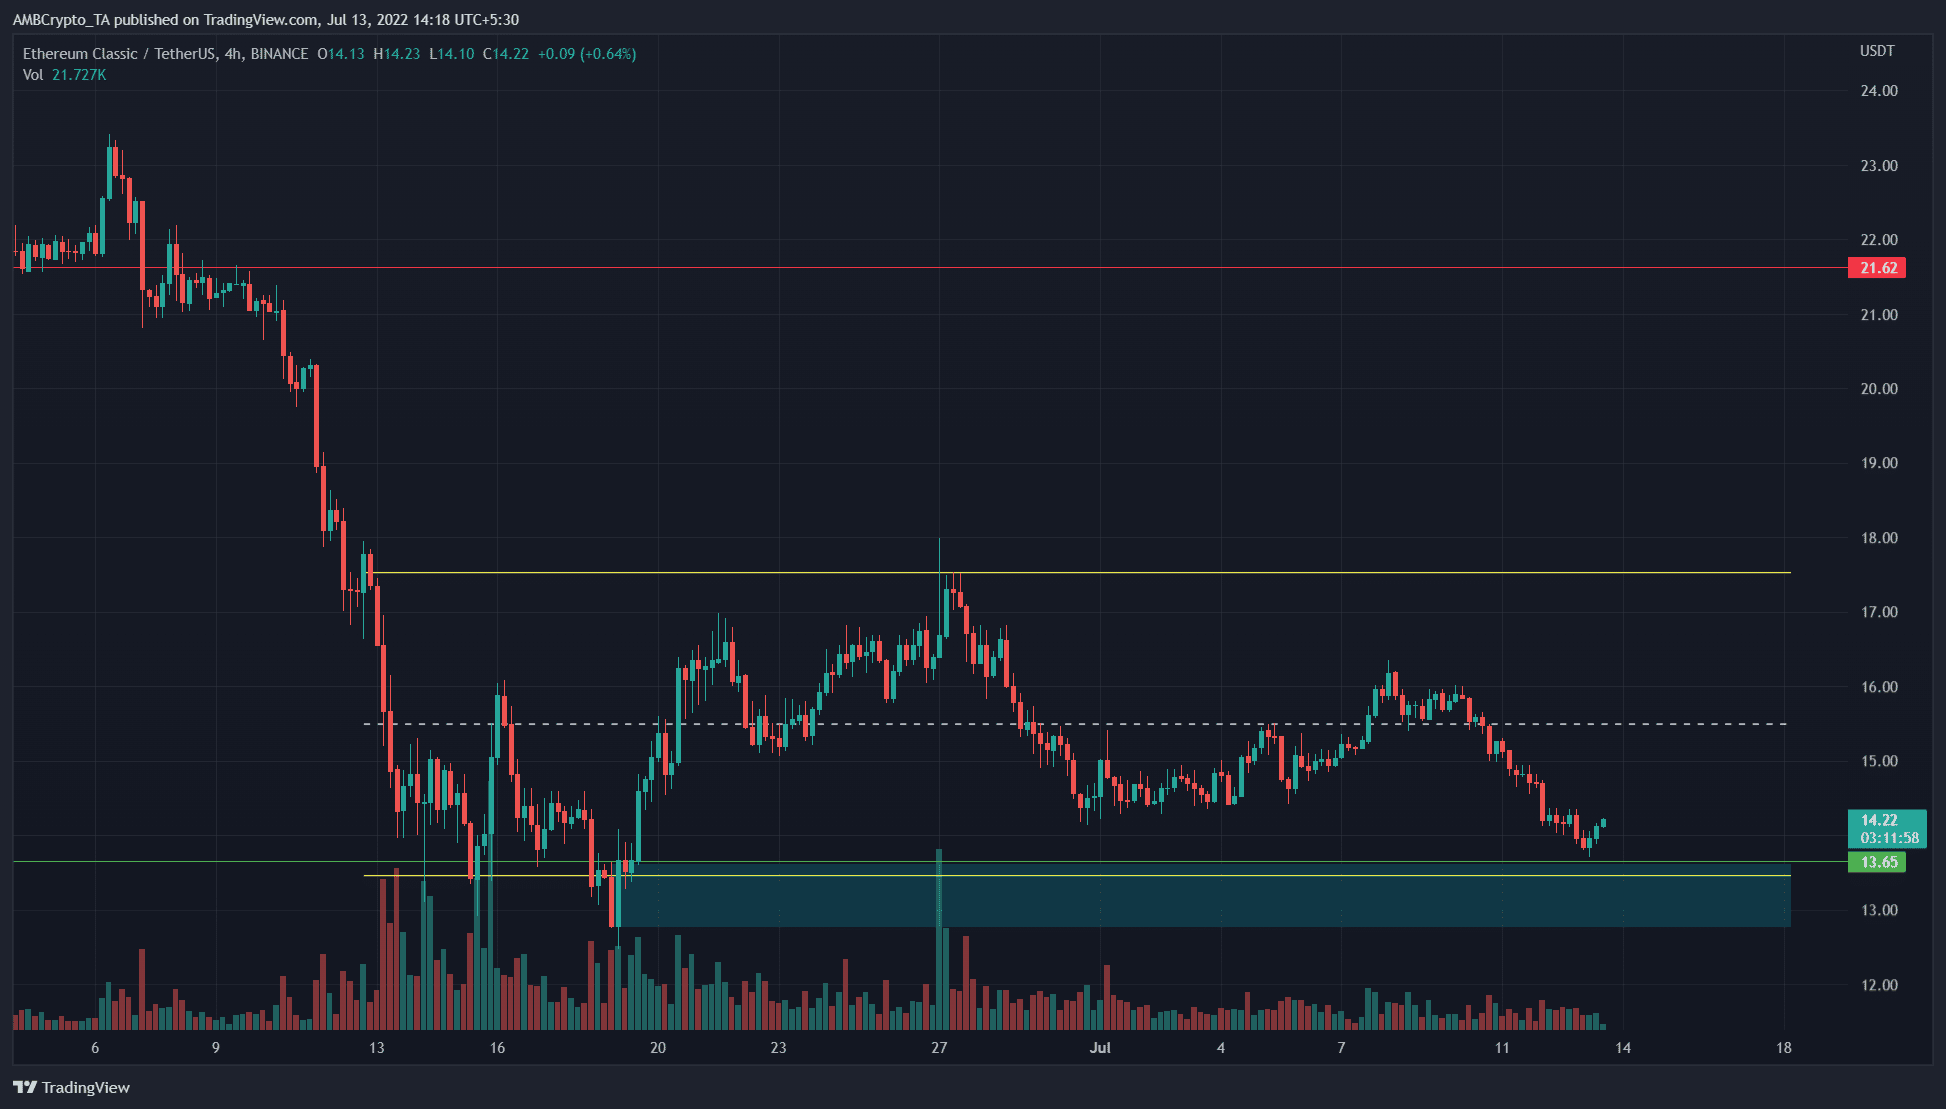
The four-hour chart showed a bullish order block for Ethereum Classic at the $13 zone, highlighted in cyan. This bullish order block sat right beneath the range lows.
Hence, even though the short-term trend over the past week was downward, it looked like a bullish move back above $15 could materialize.
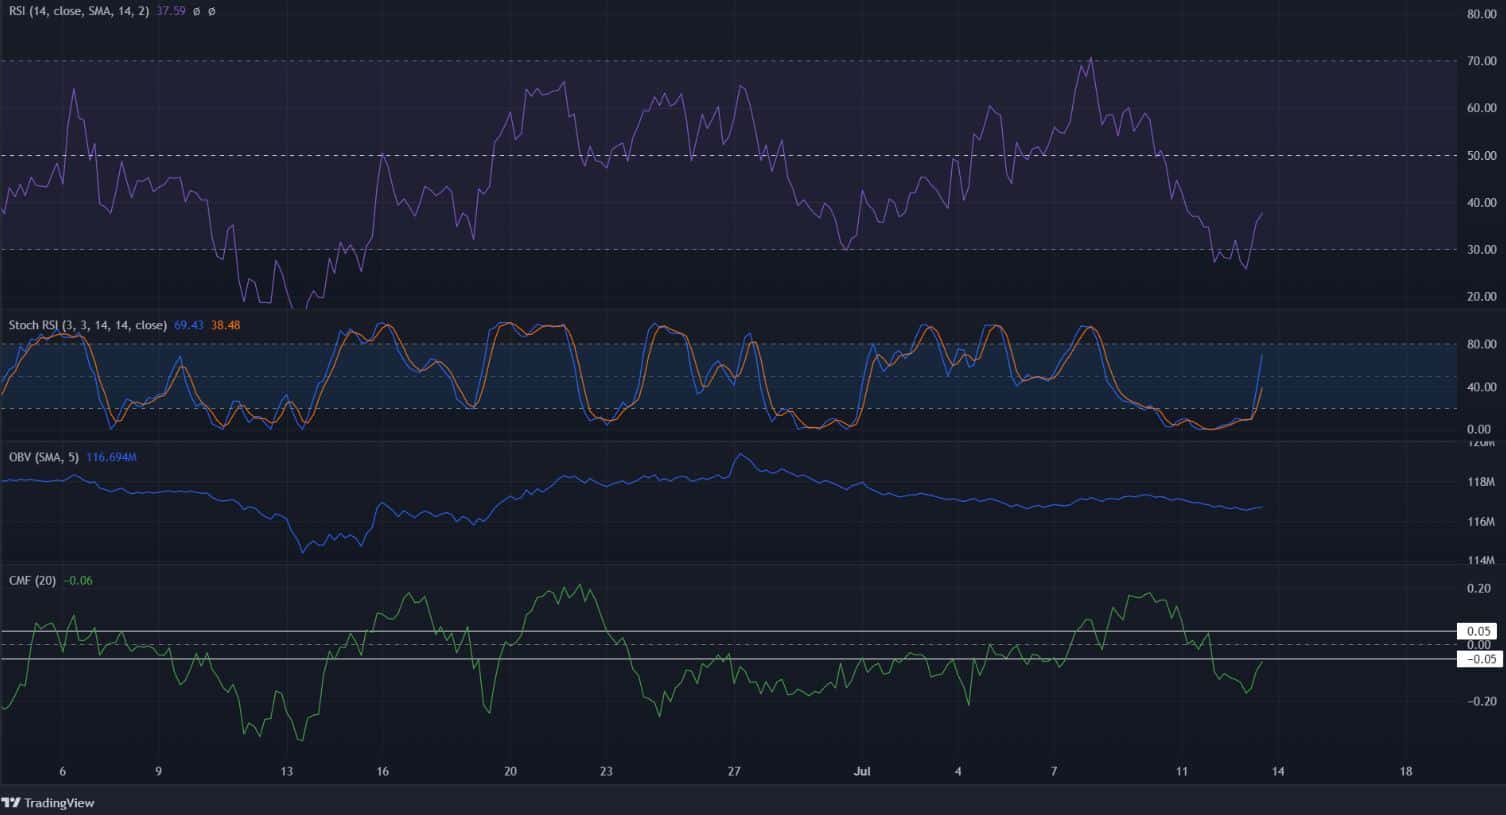
The indicators on the four-hour chart pointed toward a bearish bias for Ethereum Classic. The Relative Strength Index (RSI) fell back beneath neutral 50 in the past week, while the Stochastic RSI raced toward the overbought territory. The On-Balance-Volume (OBV) has declined over the past two weeks.
Without strong demand, a rally might not occur in the next few days. Hence, apart from the $13 area, the OBV was also an indicator to keep an eye on. The Chaikin Money Flow (CMF) fell beneath the -0.05 mark a few days ago. This showed significant capital flow out of the market.
Conclusion
Even though the four-hour indicators showed a bearish bias for Ethereum Classic, the bullish order block at the range lows was a decent opportunity to enter a long position. A tight stop loss at the $12.2-$12.8 area can be used. Dollar-cost averaging can be used to enter a long position all the way down to $13.
However, since this trade would go against the trend, it could be riskier. Therefore, the position must be sized more carefully.