ETC: Gauging potential targets of this bullish pattern’s breakout

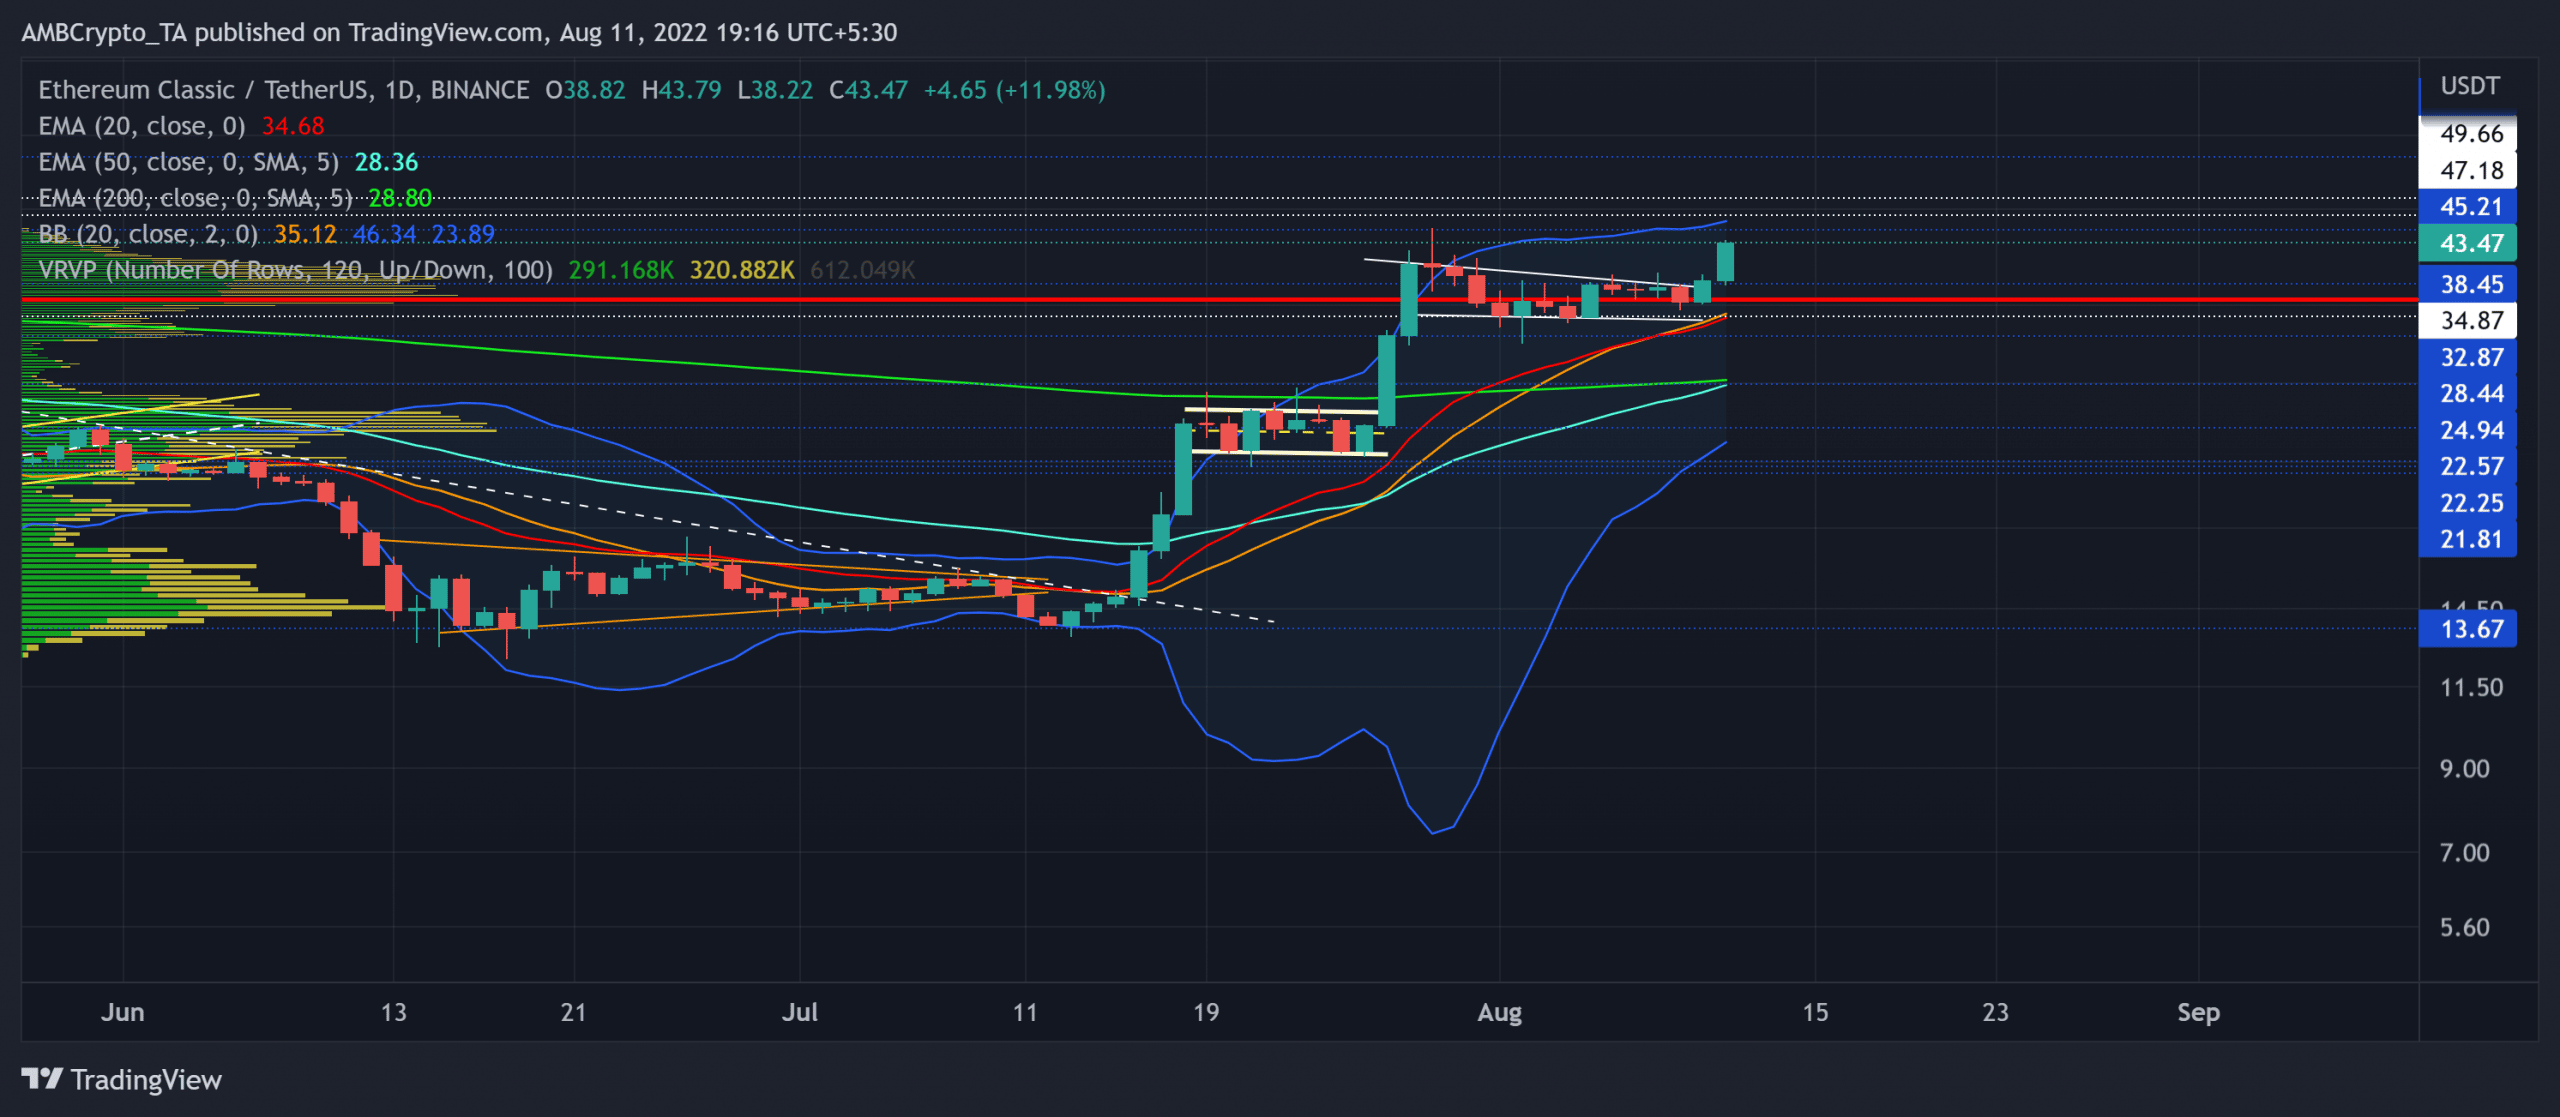
Over the last month, Ethereum Classic [ETC] witnessed no bounds to its growth that extended from the $13-mark. This buying comeback positioned the altcoin near the upper band of the Bollinger Bands (BB) and reaffirmed the one-sided buying edge.
ETC jumped over the basis line of its BB after snapping its long-term trendline support (previous resistance) (white, dashed). Its current patterned breakout could see near-term hurdles in the immediate resistance range. At press time, the alt traded at $43.47, up by 12.02% in the last 24 hours.
ETC Daily Chart
The four-month trendline resistance (now support) curtailed the buying pressure until mid-July. Then, following the broader market recovery, ETC established a foothold above the EMA (red) and the 50 EMA (cyan).
The rebound from the $13.6 level laid the foundation for a whopping 217% ROI until press time. Naturally, the basis line and the near-term EMAs kept looking north to reflect the increasing buying pressure.
While the Point of Control (POC, red) provoked a bullish pennant-like structure, the recent bullish engulfing candlestick confirmed the bullish breakout. The previous bullish flag breakout made way for another bullish push in the daily chart.
With the $47-$49 range resistance standing sturdy, reversals from this level could induce a near-term slowdown.
In this case, the buyers could look to re-enter from near the POC in the $34-$36 range. A potential golden cross of the 50 EMA and the 200 EMA green can further strengthen the chances of continued growth.
Rationale
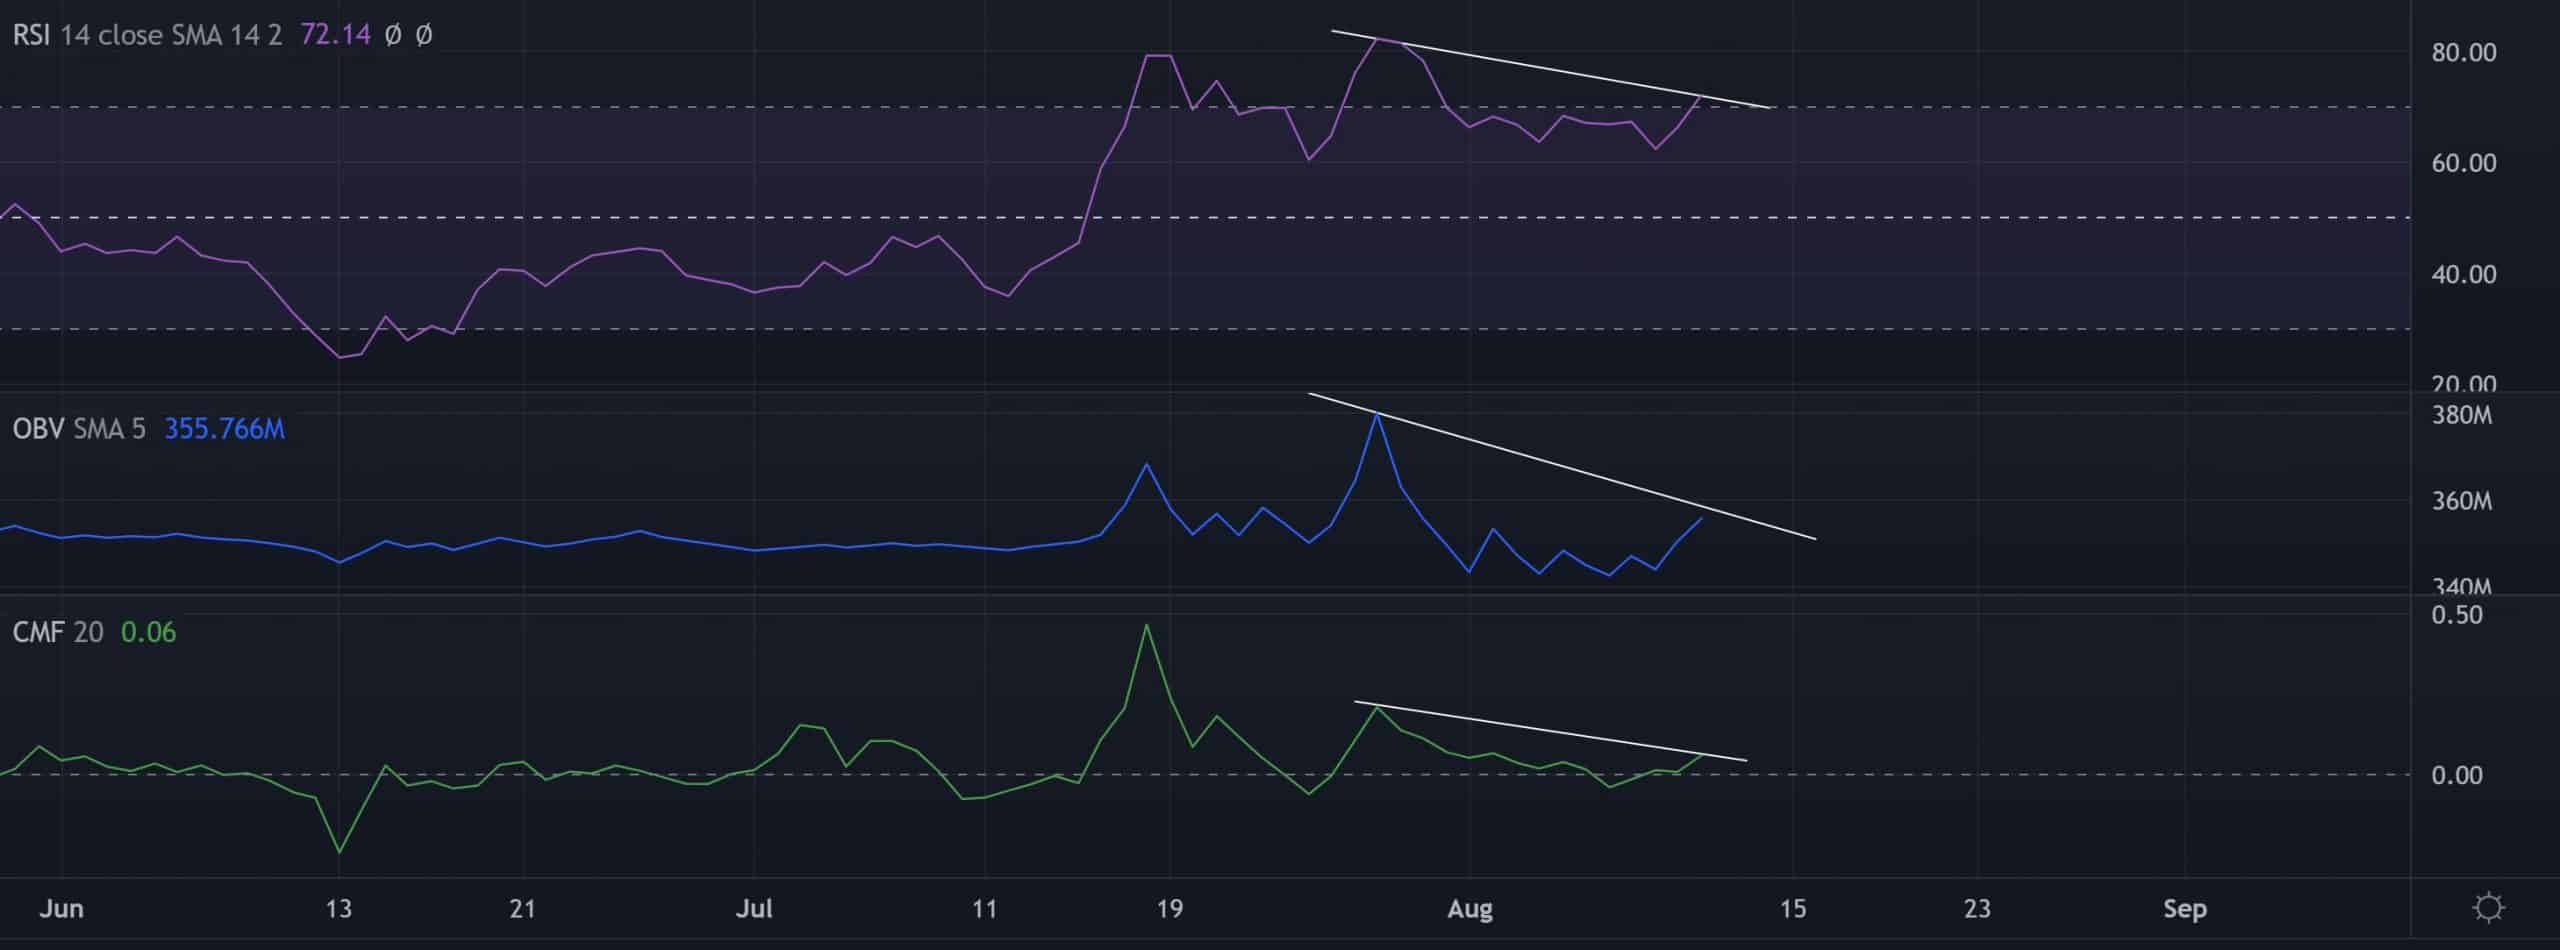
The Relative Strength Index (RSI) hovered in the overbought region to reflect a robust buying edge. A potential reversal from this region could ease the heightened buying pressure.
Also, the OBV and the CMF saw lower peaks over the last few days. Any reversals from their trendline resistances can confirm a bearish divergence with the price.
Conclusion
ETC’s bullish pennant breakout could find a ceiling in the $47-$49 range. A near-term pullback would then have strong rebounding chances for continuing the alt’s bullish run. The take-profit levels would remain the same as above.
Finally, the broader market sentiment and the on-chain developments would play a vital role in influencing future movements. This analysis is critical to identify any bullish invalidations.


