ETH active addresses drop to 4-month low; is capitulation event in sight

Since the merge, the count of trades on the Ethereum [ETH] network has been plagued by decline, new data from Santiment revealed.
According to the blockchain analytics platform, the count of daily active addresses that traded ETH dropped continuously since the merge to sink to a 4-month low on 20 October. This resulted from “weak hands” that consistently distributed the leading altcoin.
Per Santiment, 17 October was the first day that ETH recorded less than 400,000 daily active addresses on its network since 26 June.
😲 #Ethereum's active addresses have sunk to 4-month lows with weak hands continuing to drop post-#merge, and disinterest at a high as prices have stagnated. Monday was the first day that there were less than 400k addresses on the network since June 26th. https://t.co/FKXHhg6Z5g pic.twitter.com/1Ekj3bpT0A
— Santiment (@santimentfeed) October 20, 2022
Dormancy and other tales
The market is marked by a significant level of investors’ disinterest in ETH, which has caused its price to stagnate. A look at the asset’s Mean Dollar Invested Age (MDIA) confirmed this. Per Santiment, the long stretch of ETH’s MDIA revealed a climbing index of dormant coins on the network.
In the last six months, the MDIA has grown by 41%. Such a prolonged stretch in an asset’s MDIA metric indicates a concerning level of stagnancy in the asset’s network. Such stagnancy makes it hard for the price of such an asset to see any significant growth.

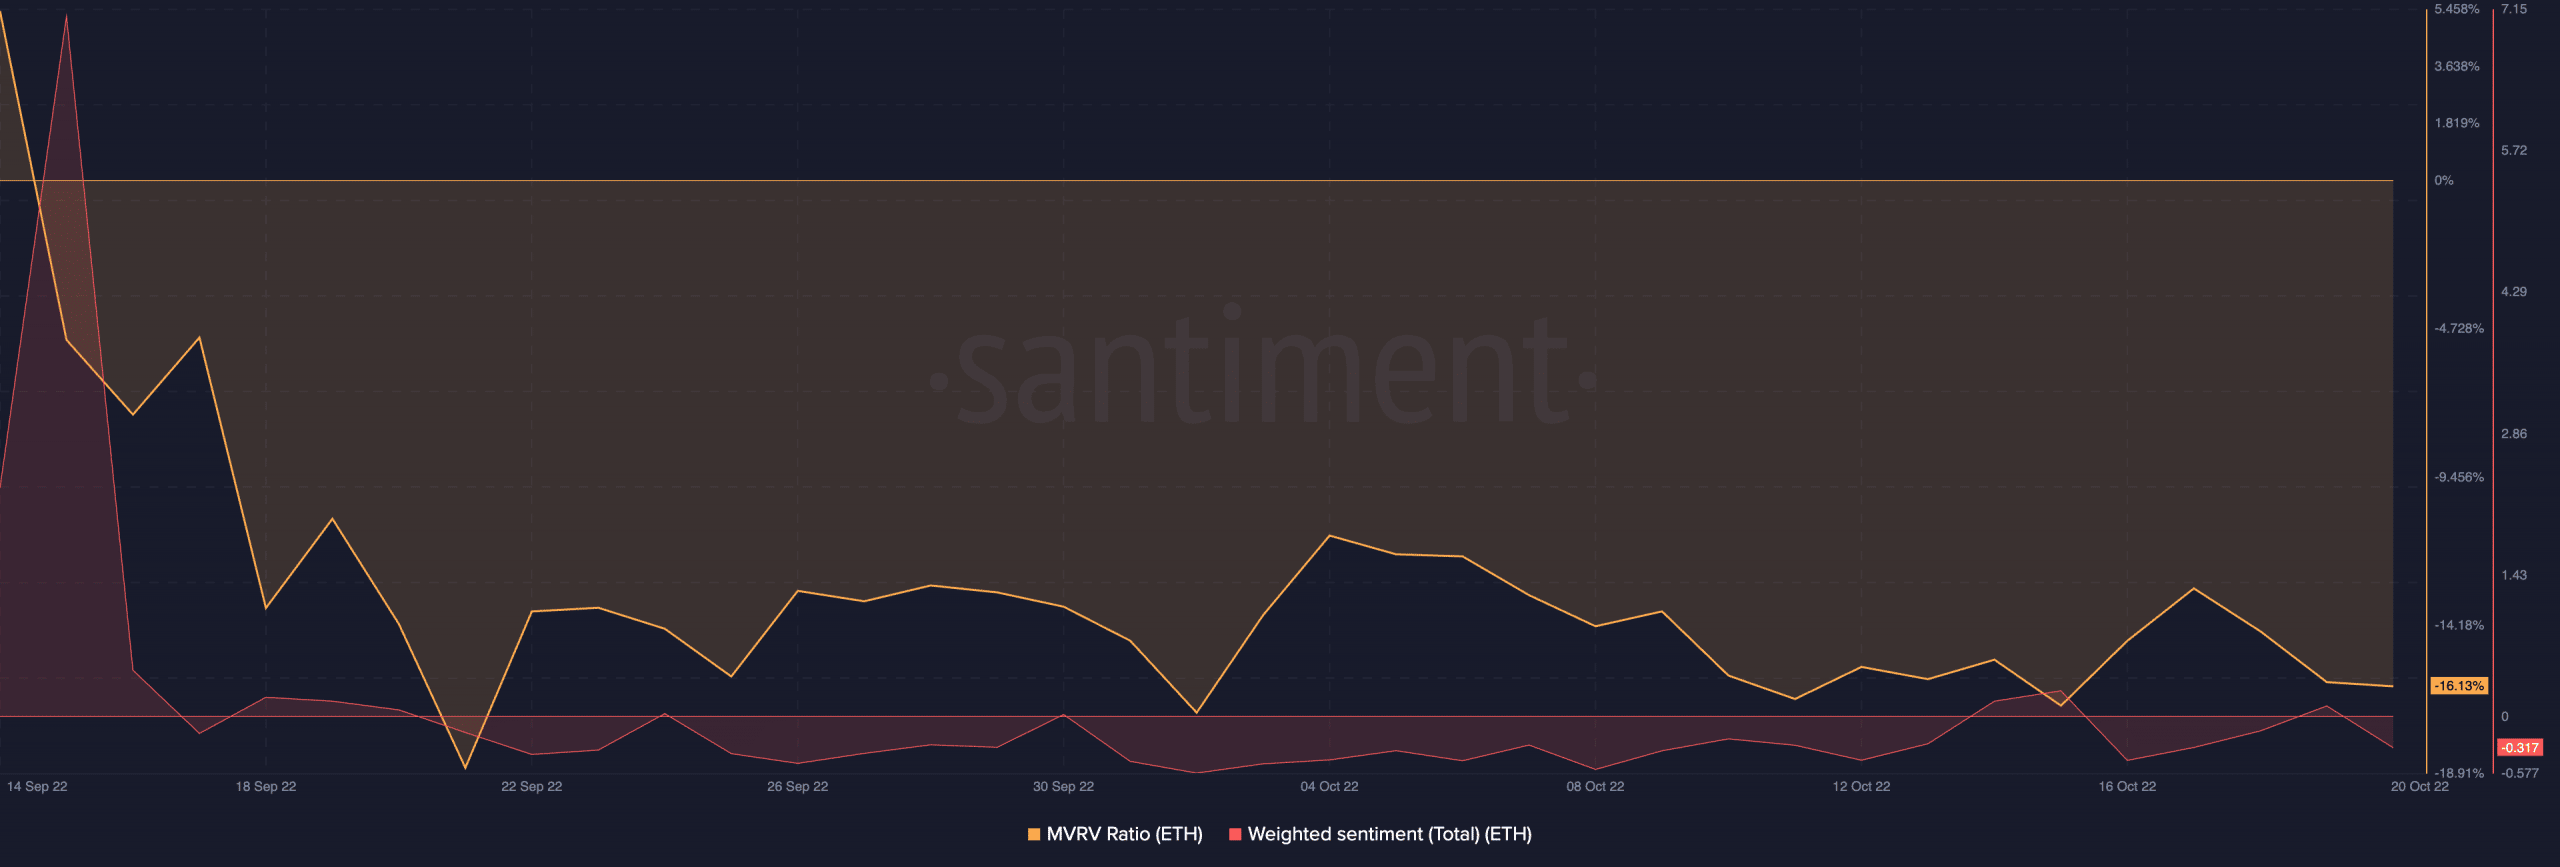
Since the merge, most ETH holders have posted losses on their investments. The alt’s market-value-to-realized-value (MVRV) fell sharply from 5.4% on 14 September and has since rested below the center 0% line.
At the time of writing, ETH’s MVRV ratio returned a negative value of -16.13%.
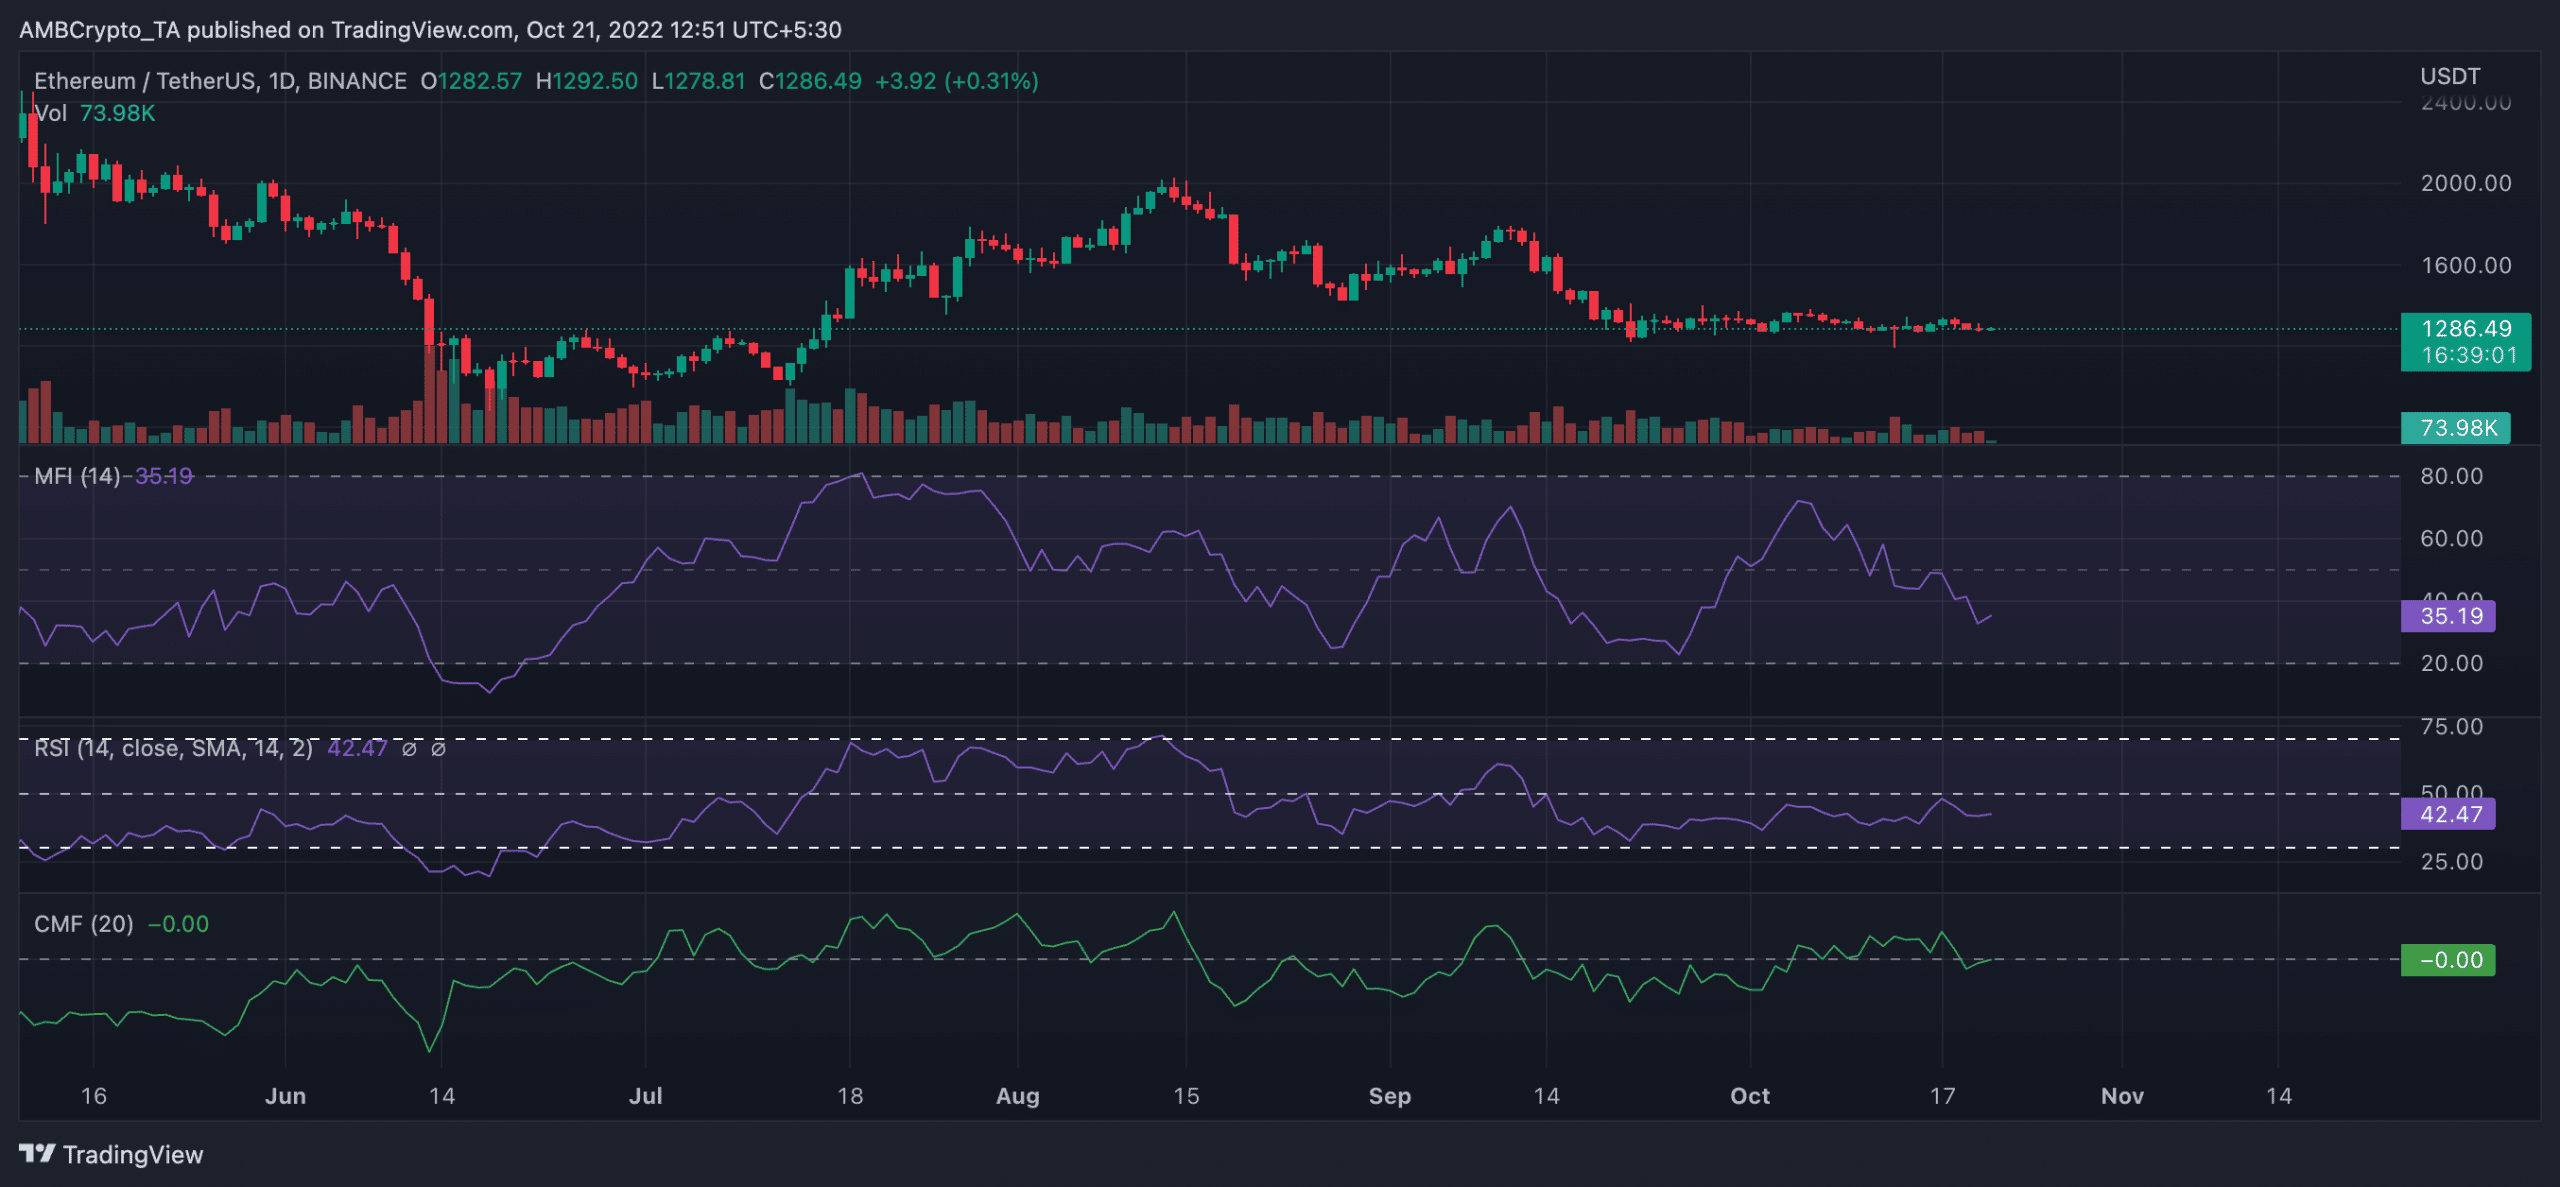
ETH exchanged hands at $1,286.43 at press time. Since the merge took place 36 days ago, its price has fallen by 21%. Due to the persistent decline of the alt and the relative unprofitability of holding it, the sentiment against it has been significantly bearish.
As of this press, ETH’s weighted sentiment was -0.317. Bearish sentiment has trailed the altcoin since the completion of the merge.
Where might the price go next?
ETH approached the oversold zone at press time. Key indicators were positioned beneath their neutral zones. The alt’s Relative Strength Index was pegged at 42.47 at press time. Its Money Flow Index (MFI) maintained its spot at 35.19.
Once these indicators hit the oversold territory, there might be a reversal as sellers would have been exhausted.
On the other hand, the Chaikin Money Flow was spotted at the neutral zero mark suggesting that buyers might be gearing up to initiate this correction.