



Ethereum [ETH] is showing early signs that investor appetite is rotating in its favor, with capital flowing toward the asset and away from rivals, most notably Bitcoin [BTC].
At press time, ETH was now closing in on the $2,000 mark, having climbed 2.32% over the past 24 hours as steady capital inflows continue to push its price higher.
ETH/BTC ratio breaks a 301-day resistance line
Notably, the ETH/BTC ratio has breached a descending resistance line that had capped it for 301 days. The ETH/BTC ratio measures the flow of capital between Ethereum, the second-largest cryptocurrency, and Bitcoin.
When the ratio climbs, it typically signals that investors are rotating capital into Ethereum, preferring Bitcoin. This marked a shift in relative demand between the two assets.
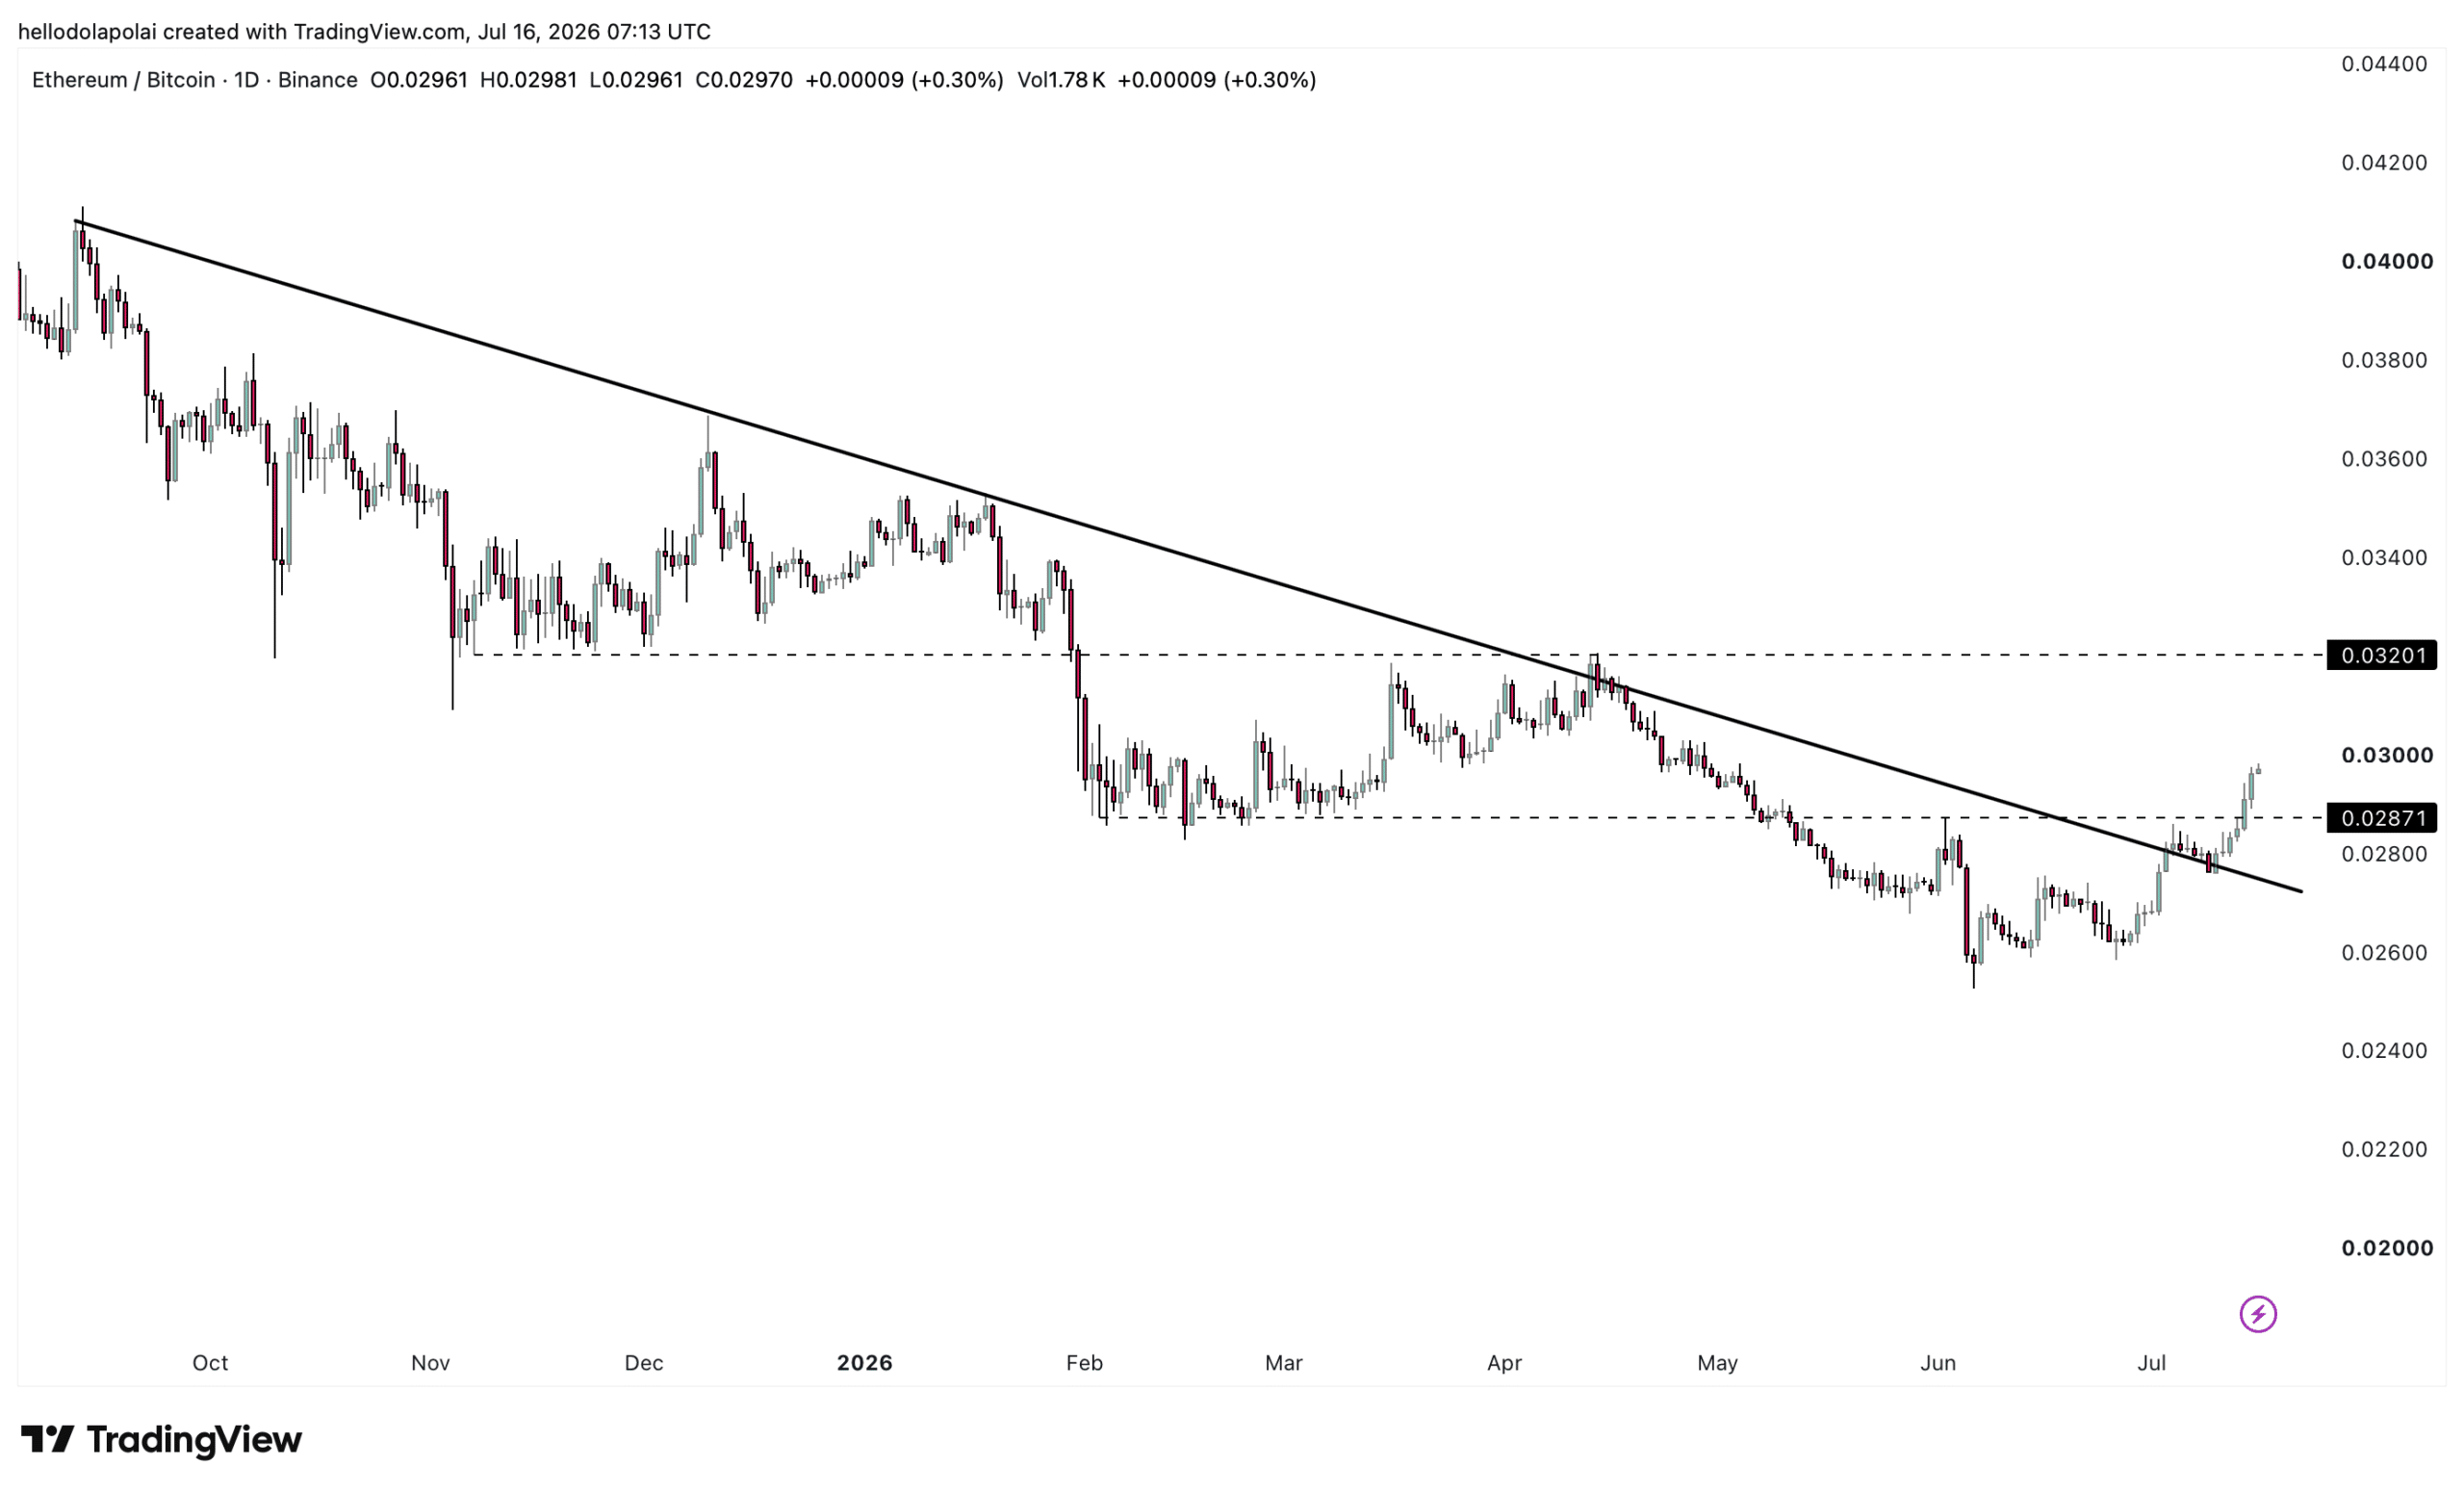
A closer look at the chart shows the breakout has been building for roughly twenty days.
Over that stretch, sixteen bullish candles have formed against just four sessions that closed below their opening price, a spread that leans heavily toward buyers.
That balance points to sustained momentum rather than a single, one-off move, and it suggests the rally has room to extend further. Should the surge hold its current path, the ratio still needs to clear a resistance hurdle at the 0.032 level before it can press on.
What’s driving Ethereum’s surge
The clearest driver traces back to spot U.S. Ethereum exchange-traded funds (ETFs), which have now recorded two consecutive trading days of net inflows.
SoSoValue data shows that between the 14th and 15th of July, these funds pulled in a combined $112 million, split across $58.34 million and $53.83 million, respectively.
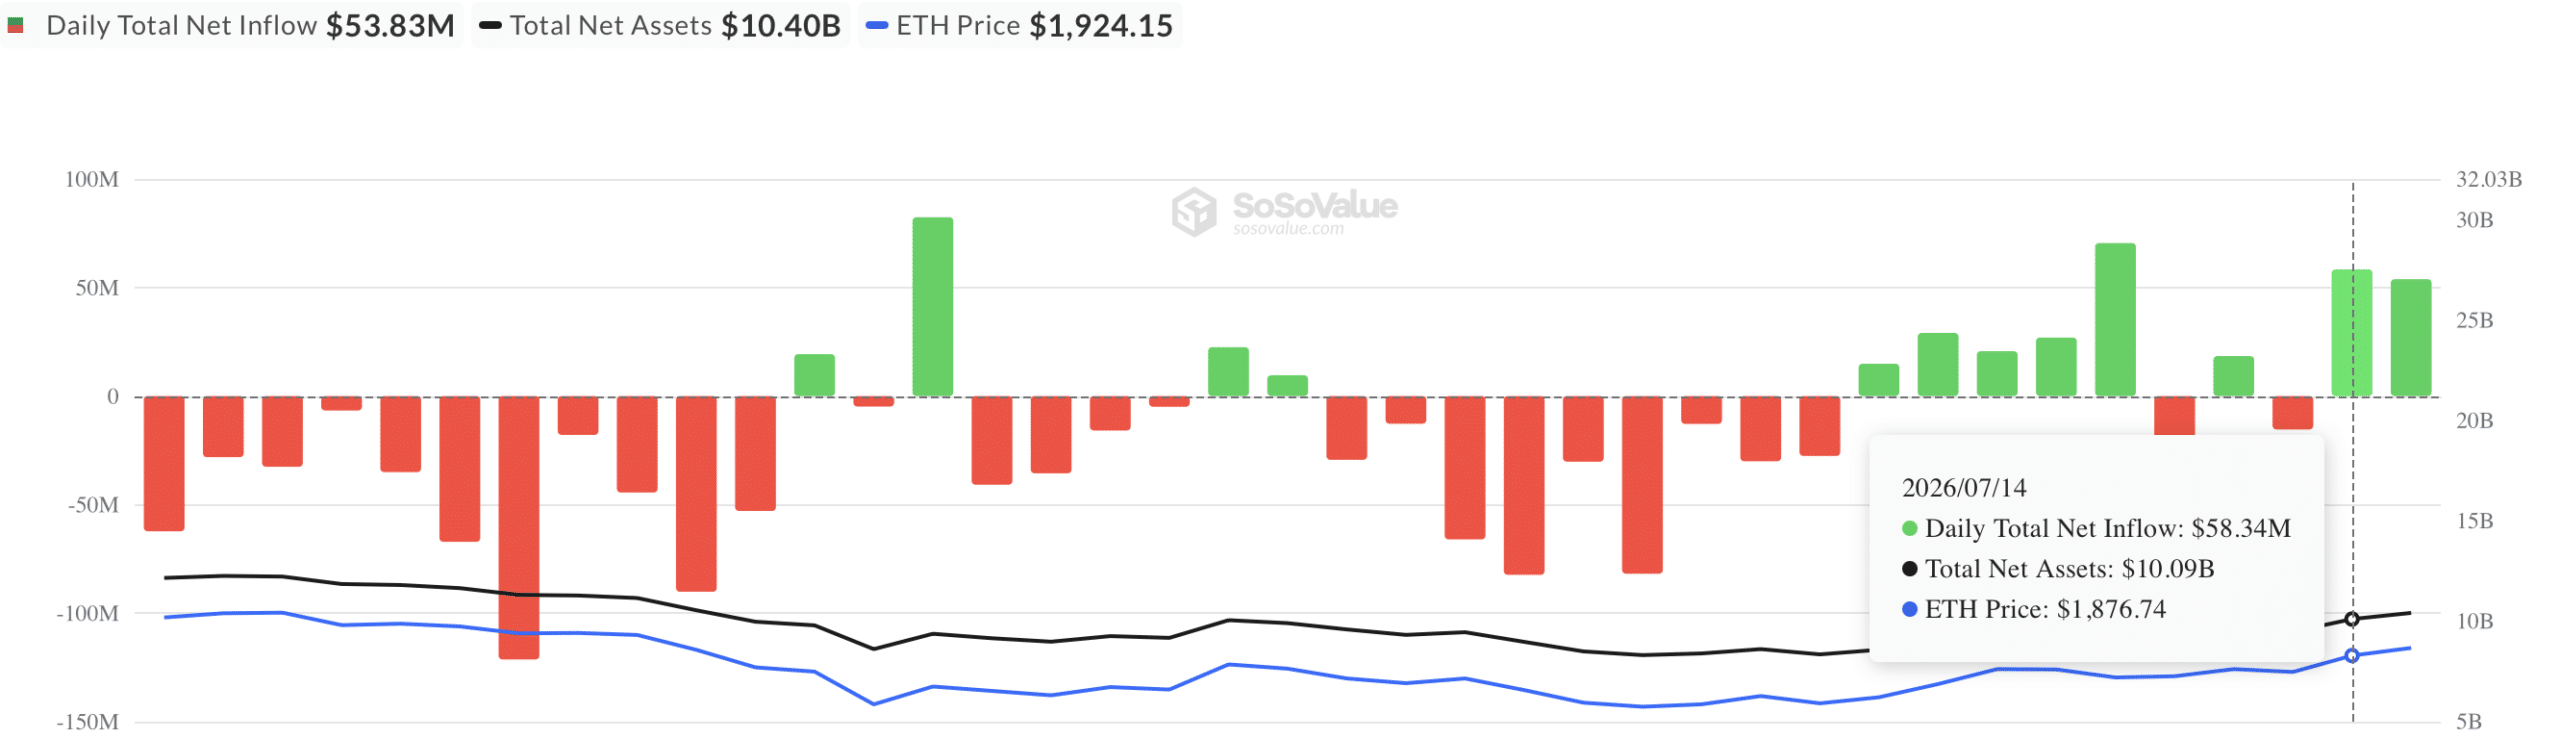
The inflows follow a softer-than-expected Consumer Price Index (CPI) reading of 3.5%, below the projected 3.8%, a cooler print that has encouraged capital back into risk assets such as Ethereum. Away from the ETFs, on-chain accumulation has been quietly building on a broader scale.
Ethereum Exchange Reserves, which track how much of the asset sits in exchange wallets and is readily available to sell, have fallen by roughly 225,000 ETH over the twelve days since the 4th of July. It slid from a high of 15.565 million ETH to 15.340 million at press time.
In dollars, investors have moved roughly $428.85 million off exchanges and into private wallets, a shift that reflects the depth of the accumulation.
Is altcoin season setting in?
The larger question is whether the market is now edging into an altcoin phase, the stretch in which altcoins begin recording outsized gains against the majors.
That question matters because the ETH/BTC chart often doubles as a proxy for altcoin momentum, and a sharp climb in the ratio has historically tended to precede a broader altcoin run.
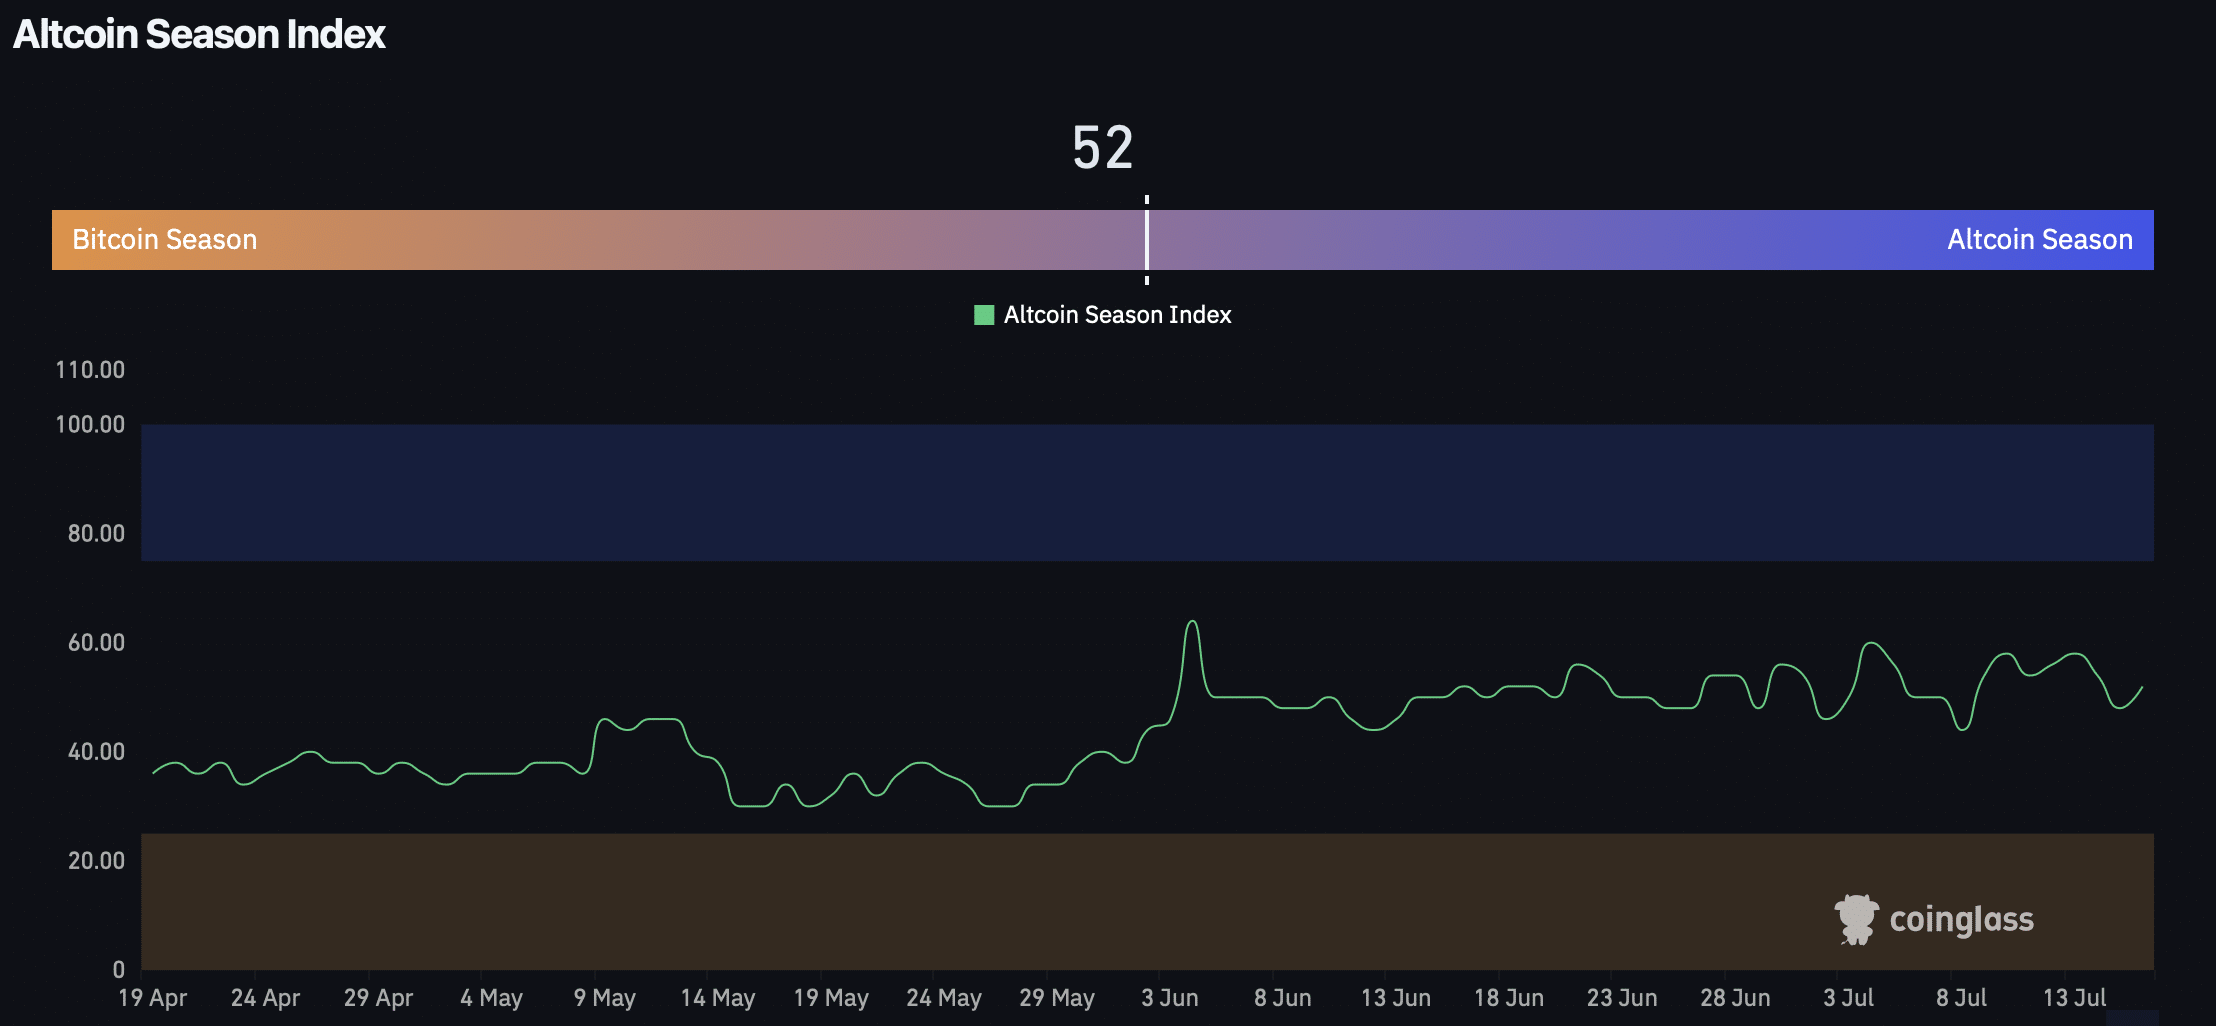
For now, CoinGlass’s Altcoin Season Index suggests the market has yet to enter that phase. A reading of 52 points to moderate flows and offers no firm confirmation of a major altcoin rally.
Final Summary
- Money is quietly moving into Ethereum ahead of rivals, pushing its price back toward $2,000.
- There are signs that investors are positioning for further gains rather than looking to sell.