ETH: Decoding take-profit levels and a potential for future rally

Disclaimer: The findings of the following analysis are the sole opinions of the writer and should not be considered investment advice
A recent report highlighted how Ethereum was entering the “Belief” stage of a rally, based on the Net Unrealised P/L metric. Generally, when the metric tips green, a sustained rally on longer timeframes has been seen in the past. In the short term, the open interest behind Ethereum Futures has been rising in the past two weeks, according to data from Glassnode. This indicated that market participants were willing to deploy their capital as they see a potential rally coming for ETH. Can ETH rally to $3800 and beyond?
ETH- 1H
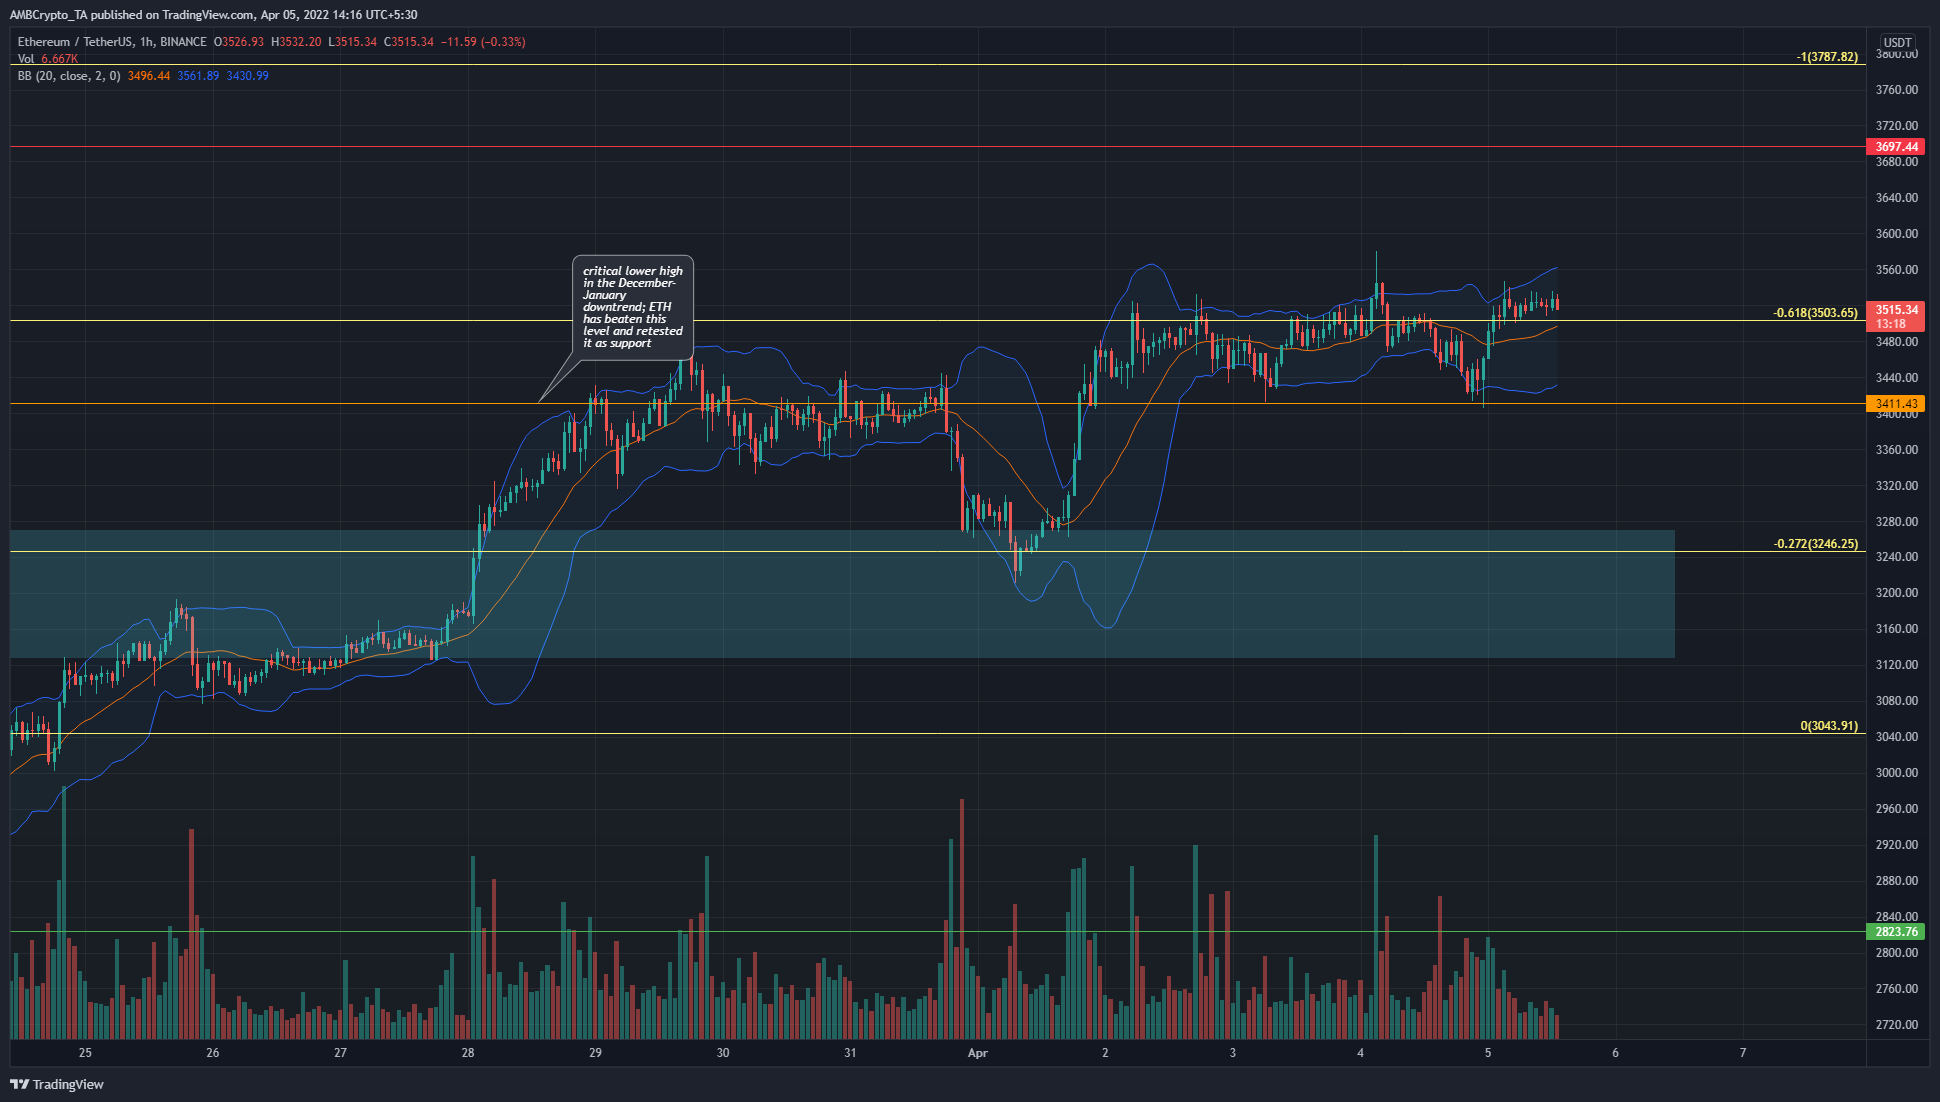
On the charts, the price has retested the 27.2% and 61.8% Fibonacci extension levels (yellow) as support in the past few days. These levels were plotted based on ETH’s move from$2300 to $3043 in late February.
The $3411 level has also been a significant longer-term level that has been flipped to support. Hence, on the charts, the price action was bullish. In the 1-hour timeframe, although some volatility could be seen, it was likely that ETH was headed to the 100% extension level at $3787.
Rationale
The Bollinger Bands on the price chart were expanding based on the price action of the previous day, which saw ETH retest $3411 as support and climb higher. The price was above the 20-period MA (orange) although it wasn’t in close proximity to the upper band, which would indicate short-term overheated market conditions.
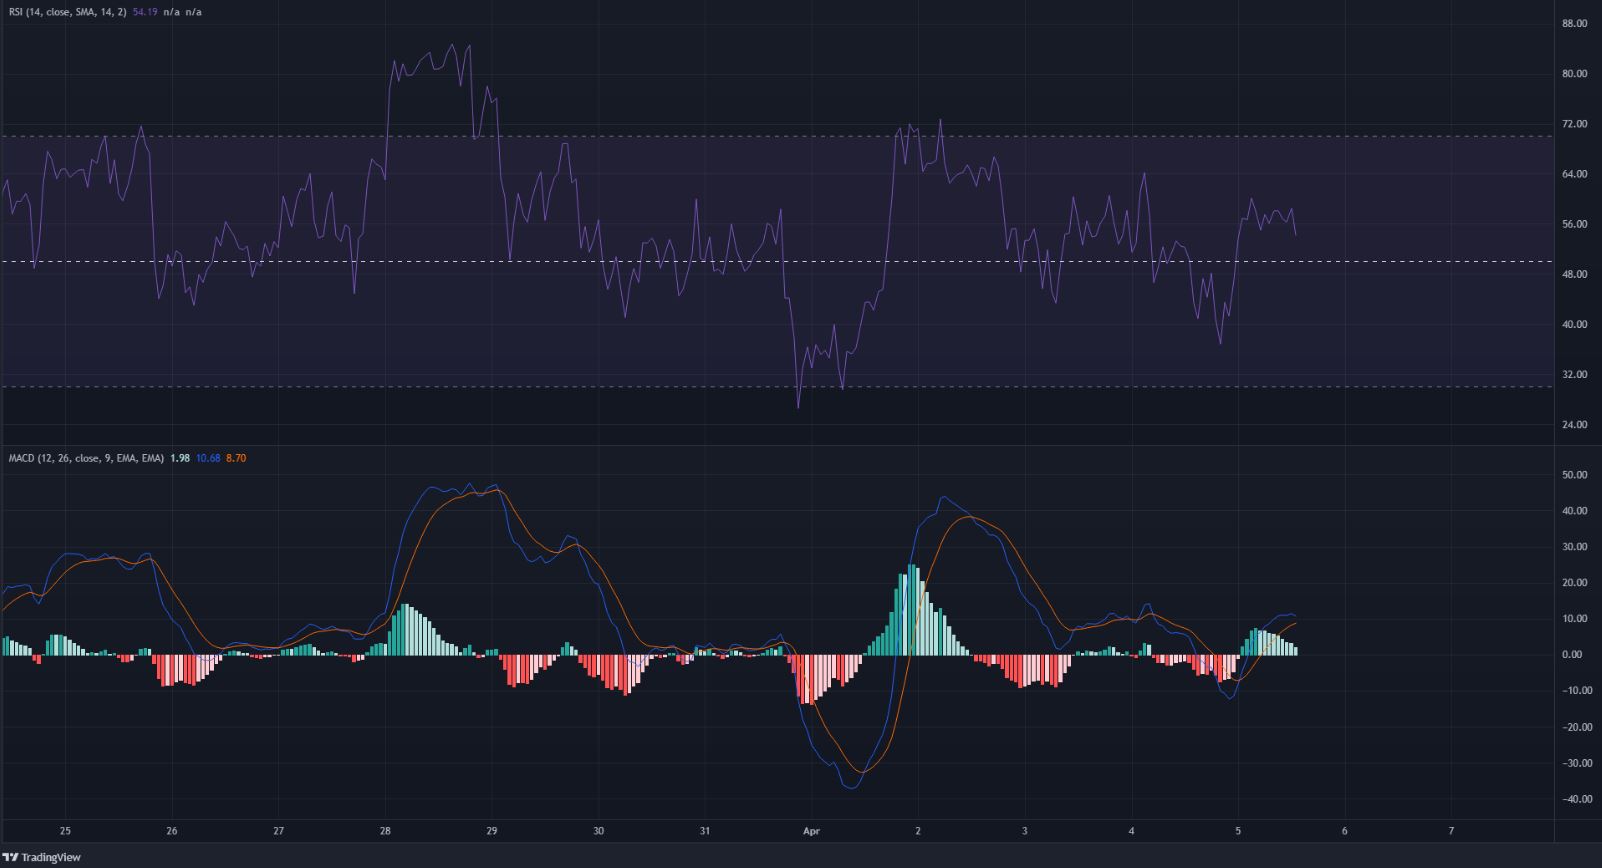
At the time of writing, the momentum was bullish according to both the MACD and the RSI. The RSI was above neutral 50, although not by a lot. The MACD was also above its zero line after forming a bullish crossover.
Conclusion
The on-chain metrics as well as longer-term price action pointed toward further bullishness for ETH. In the next few hours to the next couple of days, a retest of the $3411 level can be considered a buying opportunity. Usually, a move past the 61.8% Fibonacci extension level would likely see the asset climb toward the 100% extension level, which in this case lies at $3787.