ETH extends its price consolidation, where can investors seek gains

Disclaimer: The information presented does not constitute financial, investment, trading, or other types of advice and is solely the writer’s opinion
- ETH continues with its consolidation range into the weekend.
- The bears had slight leverage despite a recent accumulation.
Since 17 March, Ethereum [ETH] has consolidated within the $1,715 – $1,840 price range. Put differently, ETH has been stuck in a sideways structure in the past seven days and could extend into the weekend.
Read Ethereum’s [ETH] Price Prediction 2023-24
In the same period, Bitcoin [BTC] oscillated between $26.67K and $28.94K. In particular, BTC dropped from the $28K to $26K zone after the Fed hiked the rate by a quarter point on Wednesday (March 22).
But it rebounded on Thursday (March 23) after hints that Fed’s rate hikes could be peaking and easing was likely.
Is a breach of the week-long range likely?
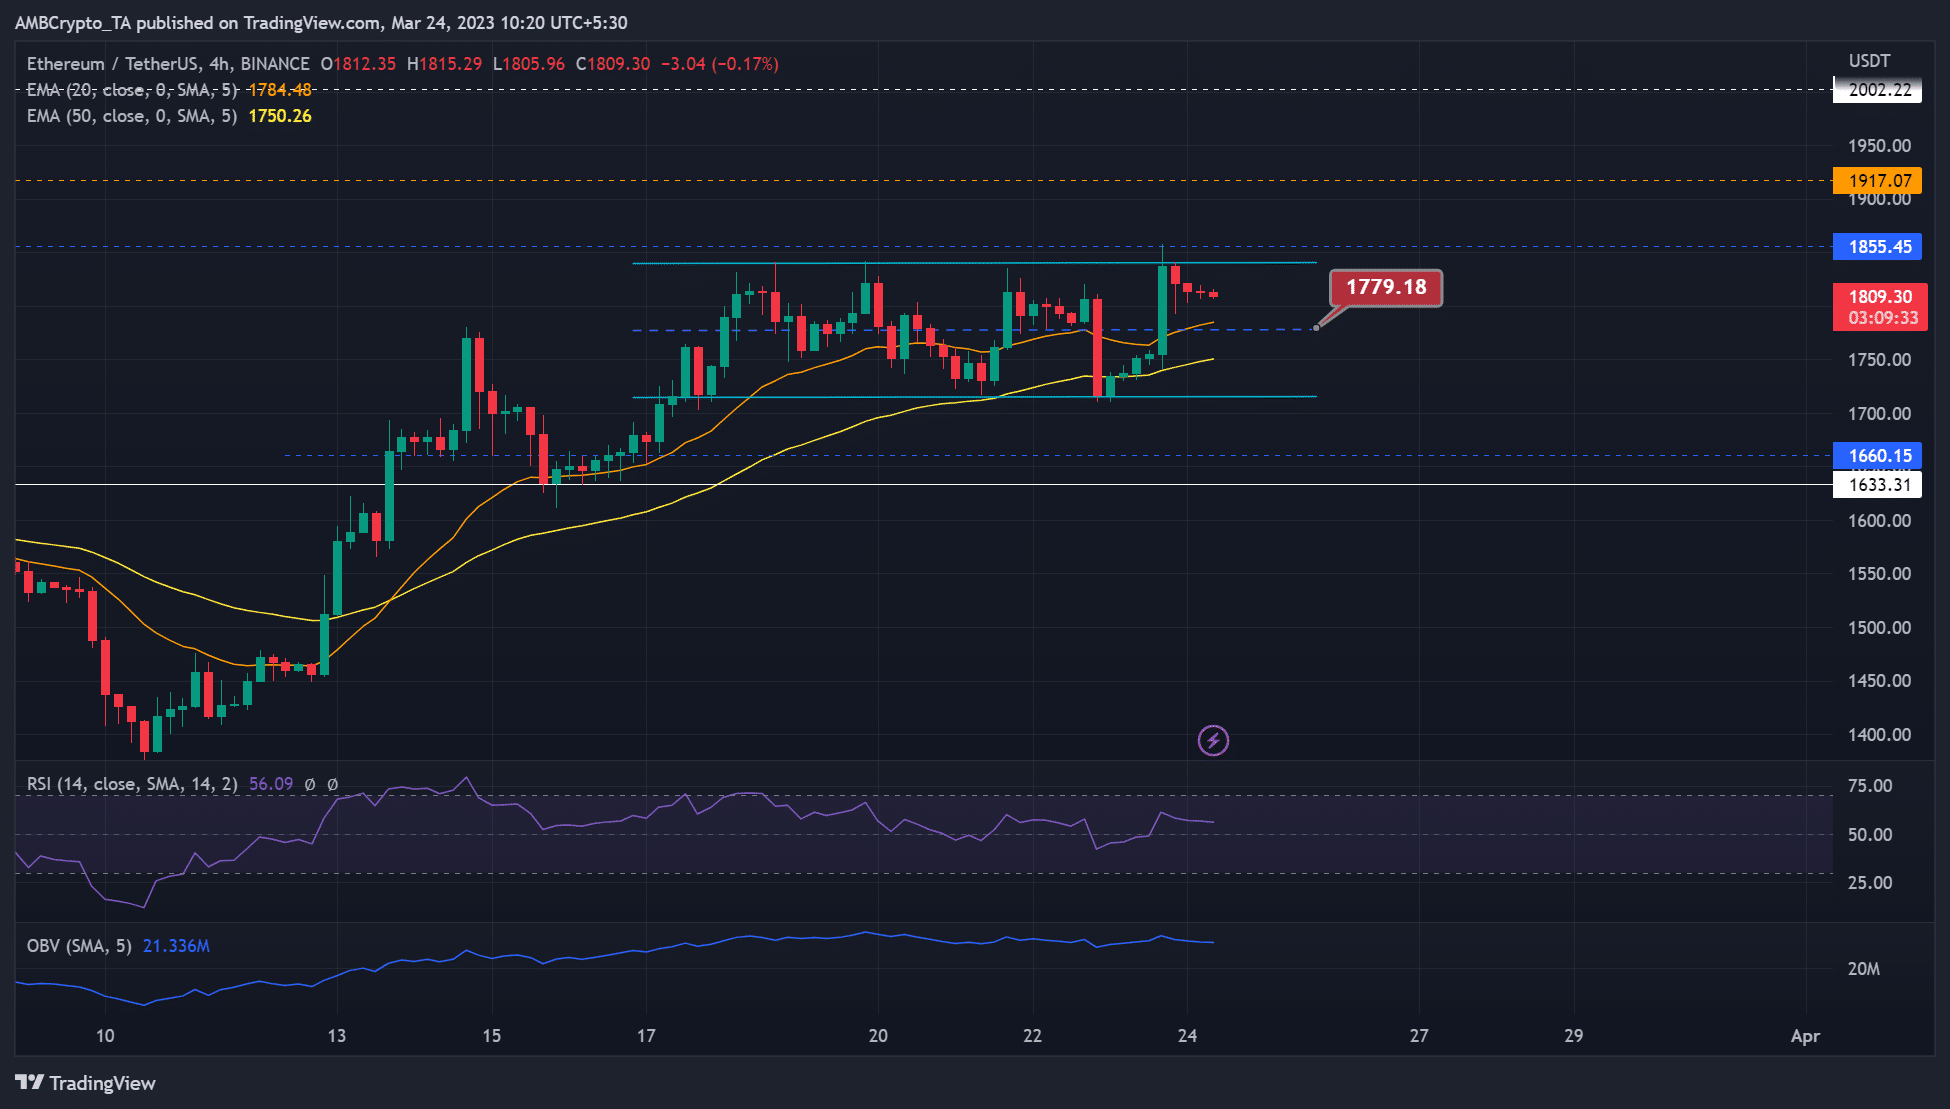
ETH followed BTC’s rebound and retested its upper range of $1,855.5. In the past seven days, ETH’s overall price action chalked a parallel channel pattern with a mid-level at $1,779.18.
The price ceiling at $1,855.5 could sink ETH to the channel’s mid-level or lower boundary. At press time, ETH’s value was $1,809.30.
Short-term bears could sink ETH to $1,779.18. However, they must clear the hurdles at $1.779.18 and 20 EMA (exponential moving average) of $1,784.5 to gain more leverage.
A close below the channel’s mid-level of $1,779.18 could attract more aggressive selling, which could likely push ETH to $1,715.
Bulls have two levels to watch out for. The mid-point of $1,779.18 could offer a steady rebound, especially if BTC attempts to retest $28.94K.
Another key support level to watch is the channel’s lower boundary of $1,715. But a breach above the consolidation range could offer bulls a chance to retest August 2022 levels of $2002. However, near-term bulls must clear the obstacle at $1,917.
The Relative Strength Index (RSI) has been predominantly above 50 for the past two weeks, indicating a bullish ETH. In the same period, OBV (On Balance Volume) increased but saw fluctuations from 17 March, undermining a strong buying pressure.
The long/short ratio gave sellers a slight edge
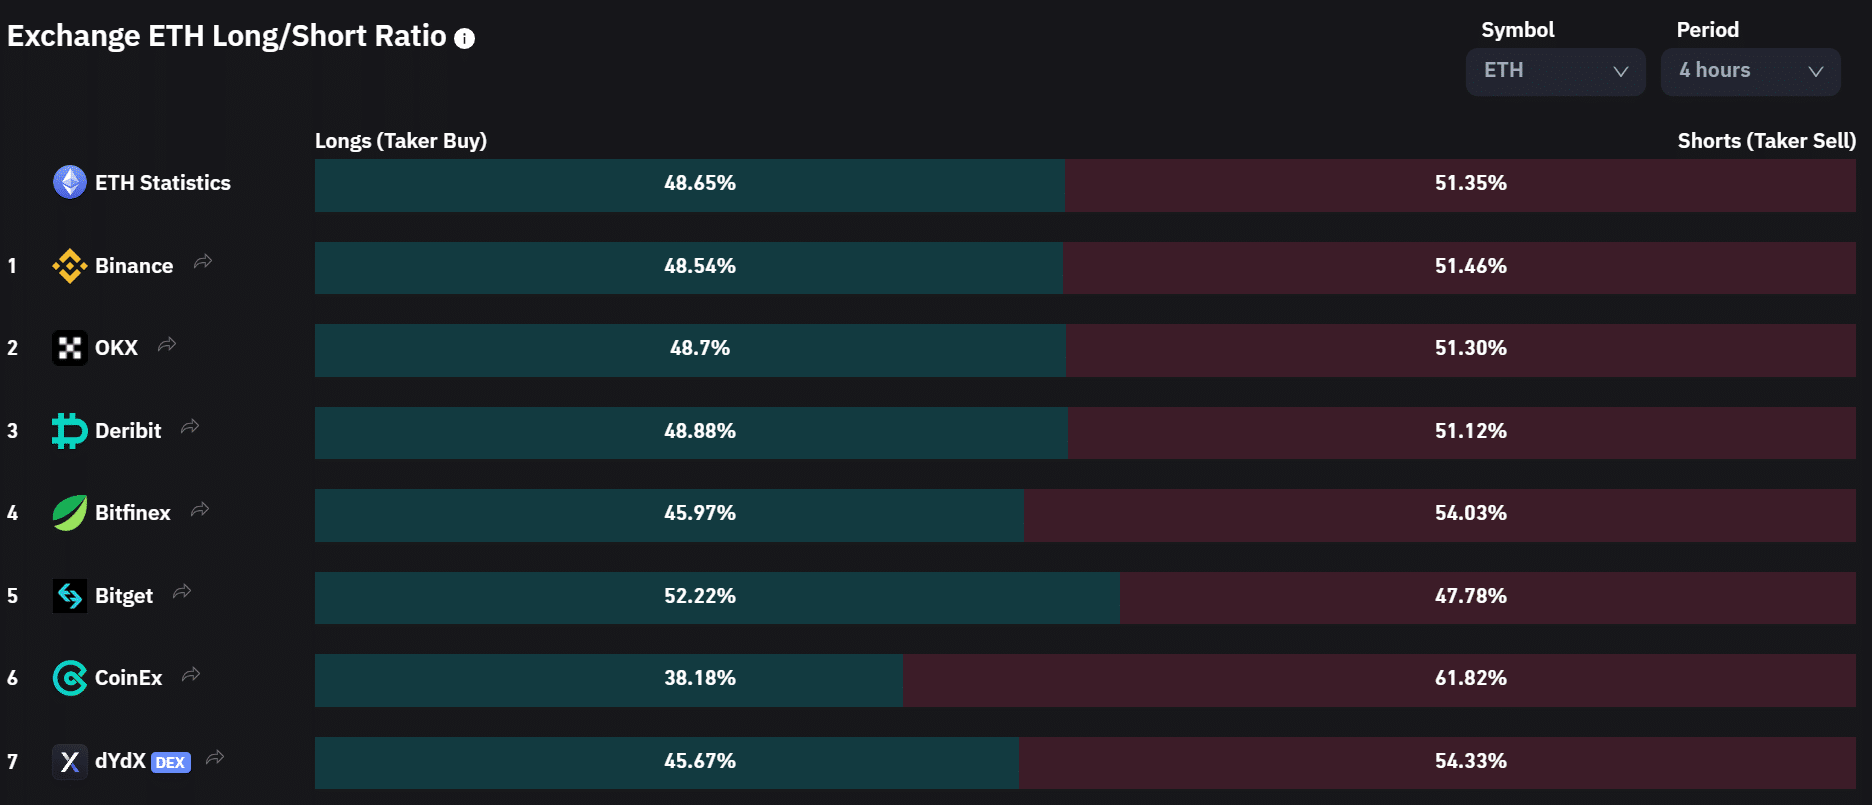
According to Coinglass, ETH’s long/short ratio across major exchanges showed sellers had slight leverage on the 4-hour timeframe. It shows most investors were bearish on the asset in the short term, which could likely push ETH to retest $1,779.18.
Is your portfolio green? Check out the ETH Profit Calculator
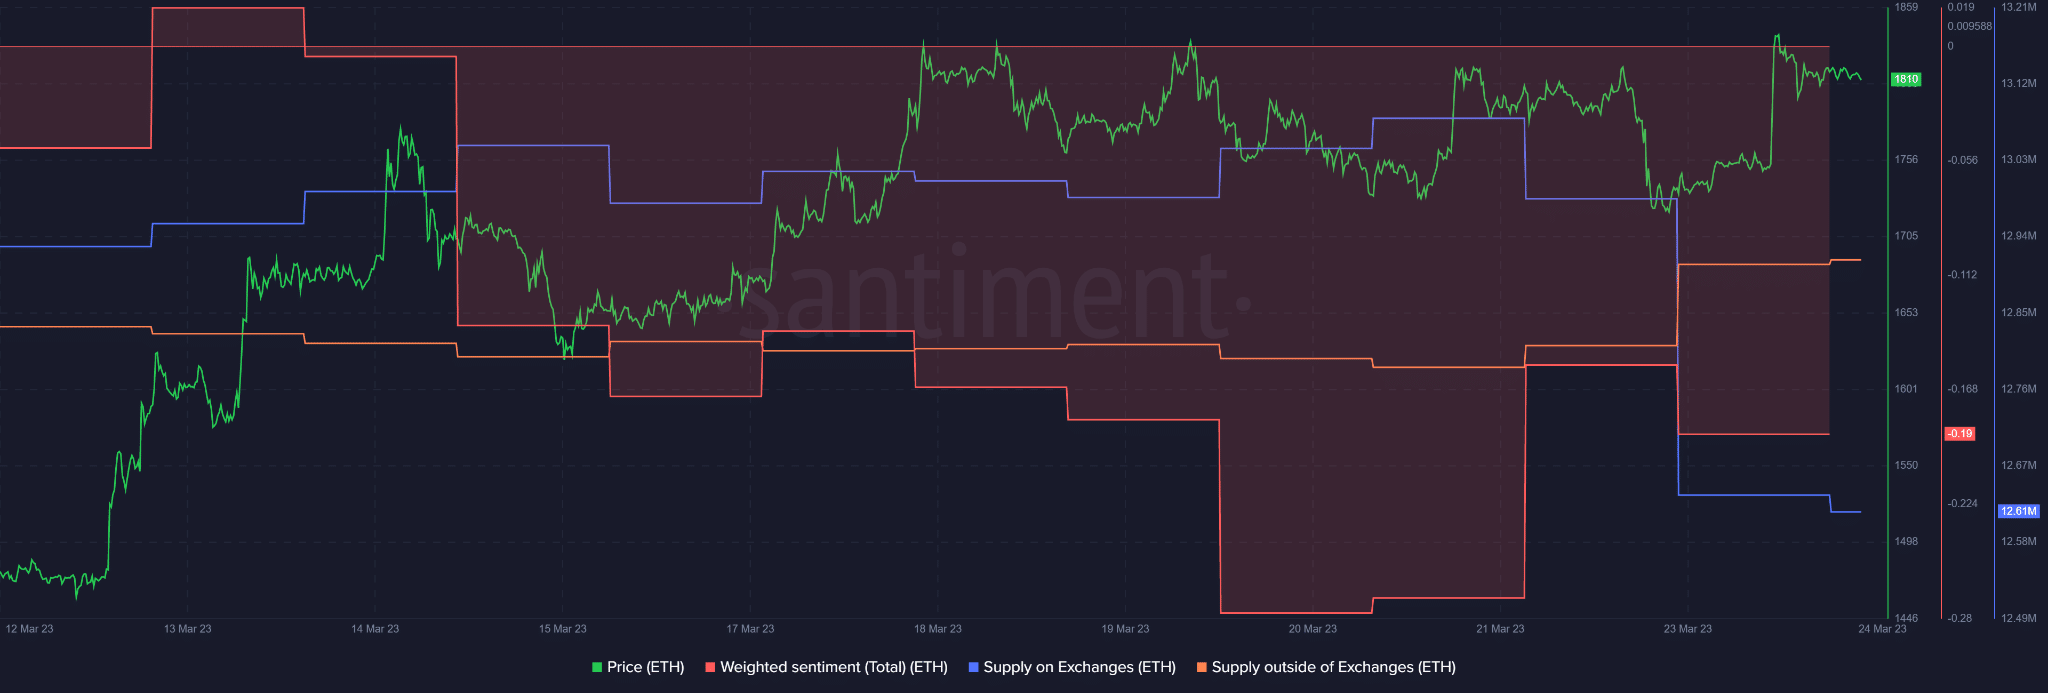
However, ETH saw short-term accumulation, as shown by the spike in supply outside exchanges. Similarly, ETH’s supply on exchanges declined at press time, indicating that fewer ETH was moved into CEXs for offloading.
Although the weighted sentiment remained negative, short-sellers should be cautious of the recorded accumulation trend. Tracking BTC’s price action could help make better moves.