
- Ethereum Foundation moved 35,000 ETH to an exchange
- ETH has responded positively to the development, with more of it leaving exchanges
Recently, the Ethereum Foundation made a notable transfer of a significant volume of its ETH holdings to an exchange. Such an action is one that typically raises concerns about potential sell-offs and downward pressure on the asset’s price.
However, the response from ETH was quite unexpected, defying the usual market reaction to such transfers.
Ethereum Foundation sells a chunk of its holdings
According to data from Spot On Chain, the Ethereum Foundation transferred 35,000 ETH to Kraken on 23 August. This transaction, valued at nearly $94 million, is the largest transfer the Foundation has made this year. Before this, the Foundation had sold approximately 2,516 ETH, spread across various smaller transactions.
Given the ongoing volatility in ETH’s price, this significant move could impact the asset’s market dynamics. Large transfers like this often raise concerns about potential sell-offs, which can lead to downward pressure on the price.
However, the market reaction may vary depending on several factors, including overall market sentiment.
Ethereum exchange flows show a more positive trend
The recent transfer of 35,000 ETH by the Ethereum Foundation to Kraken was indeed a significant transaction, leading many to anticipate a corresponding impact on exchange flows.
Surprisingly, however, an analysis of the exchange flow on 23 August revealed that more ETH left exchanges that day than entered them.
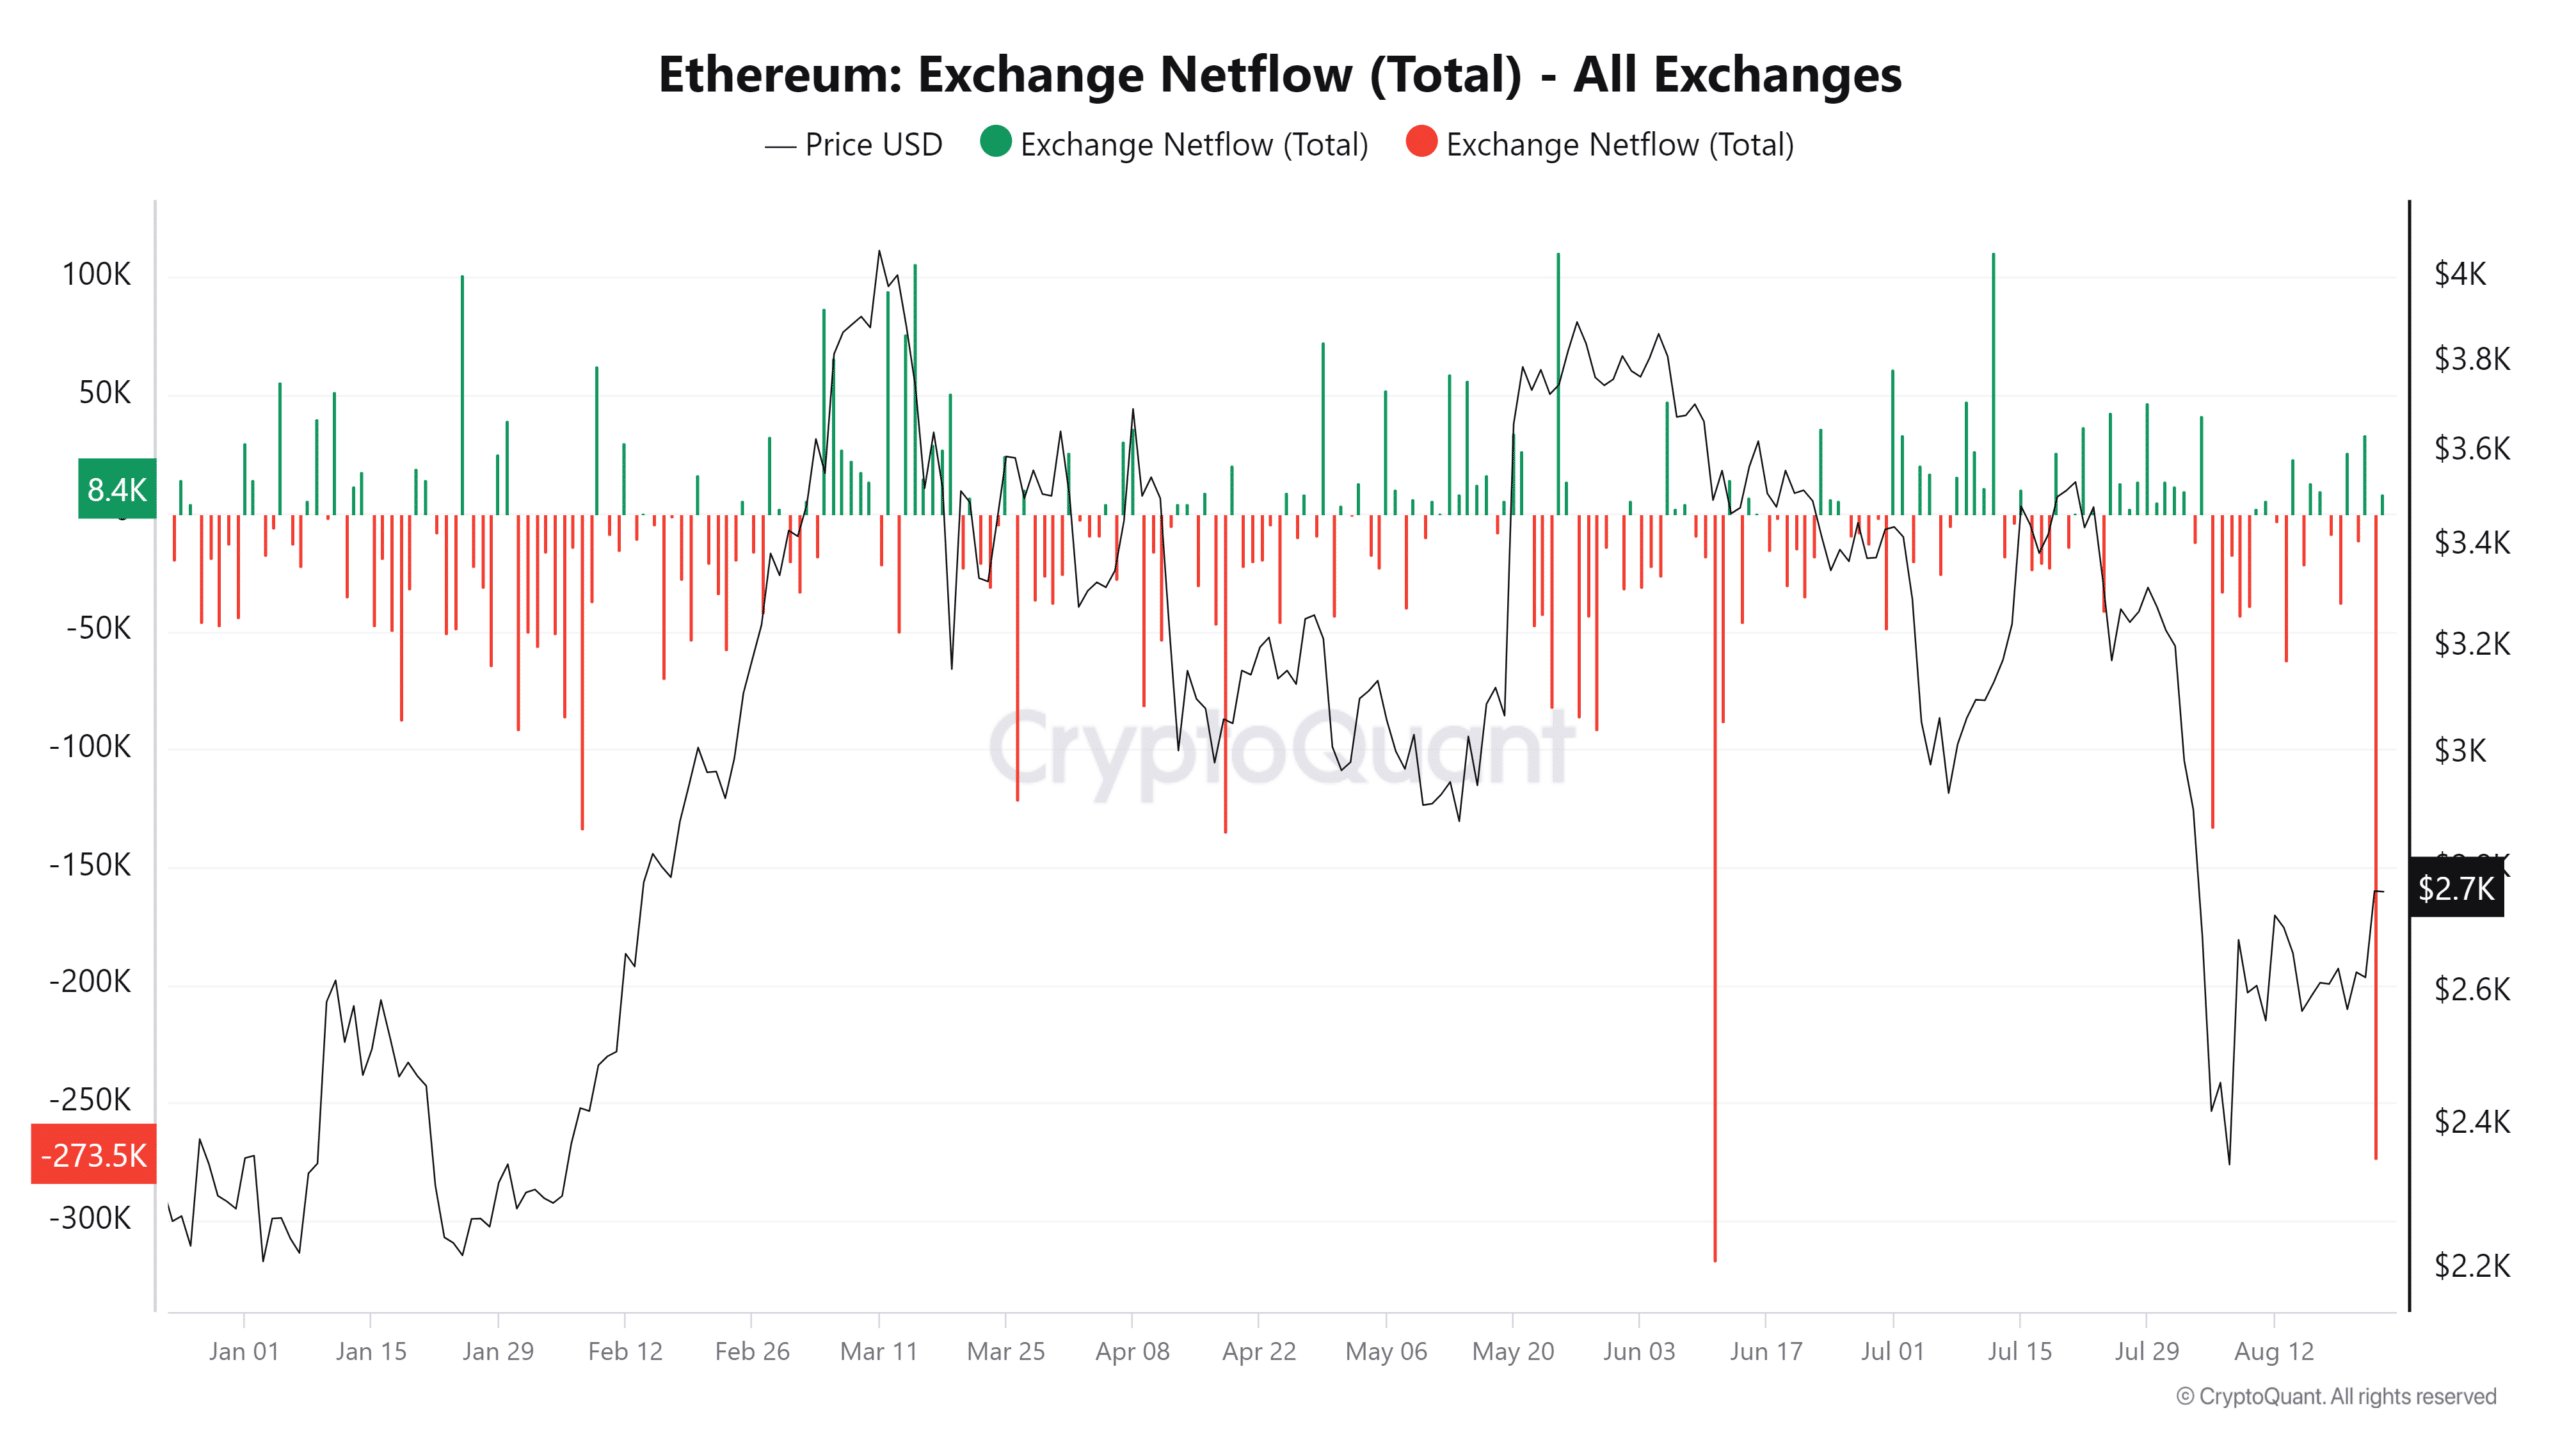
Source: CryptoQuant
The netflow data revealed substantial outflows too, with ETH noting the second-highest negative netflows of the year. According to data from CryptoQuant, the netflow on 23 August was -273,596 ETH, with the highest negative netflows recorded at -317,197 ETH in June.
This indicated that despite the Ethereum Foundation’s large transfer, there was a greater movement of ETH away from exchanges. This typically signals that investors are withdrawing their holdings, possibly to hold in cold storage or participate in staking.
Such behavior can be interpreted as a bullish signal, as it is a sign of confidence in the long-term value of ETH.
Social and volume metrics see slight bumps
A recent analysis of Ethereum’s social dominance on Santiment revealed a notable hike over the past 24 hours. At the time of writing, Ethereum’s social volume had risen to over 10%, indicating that it currently accounts for more than 10% of the overall crypto-related discussions.
Additionally, its trading volume registered a slight hike during the same period. The volume climbed to approximately $15.8 billion, up by over $2 billion, compared to previous days.
This uptick in volume, coupled with the heightened social dominance, suggests a positive trend for Ethereum.
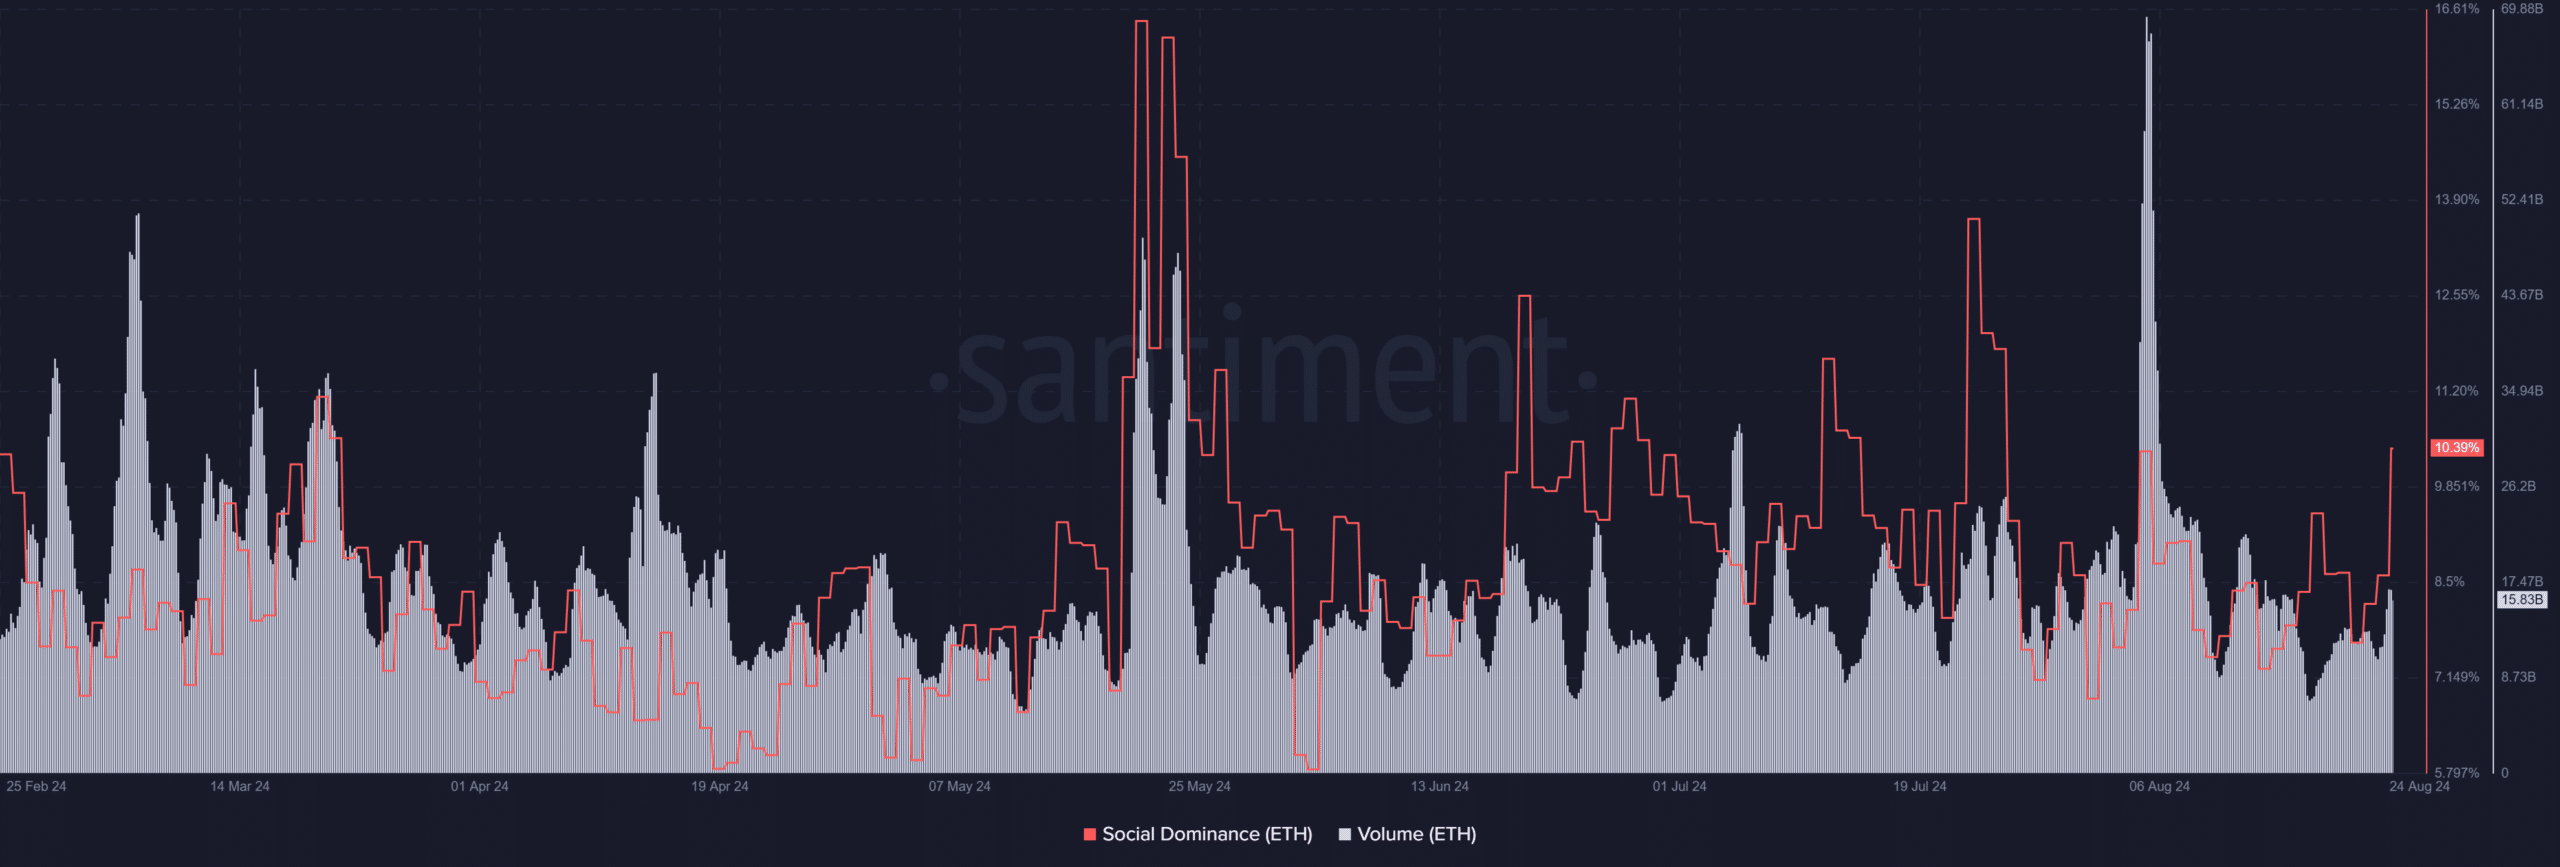
Source: Santiment
Needless to say, these metrics are bullish indicators.
The growing discussion around Ethereum, combined with rising trading activity, are a sign that market participants are actively engaging with ETH. This could potentially signal further price appreciation if the trend continues.
ETH spikes by 5% on the charts
An analysis of Ethereum’s daily price movement revealed a significant bout of appreciation in the last trading session.
According to AMBCrypto’s analysis, its price hiked by 5.39%, with the altcoin trading at $2,764. Despite this notable gain, however, Ethereum’s broader bullish trend is yet to fully materialize.
This was evidenced by its moving averages and Relative Strength Index (RSI).
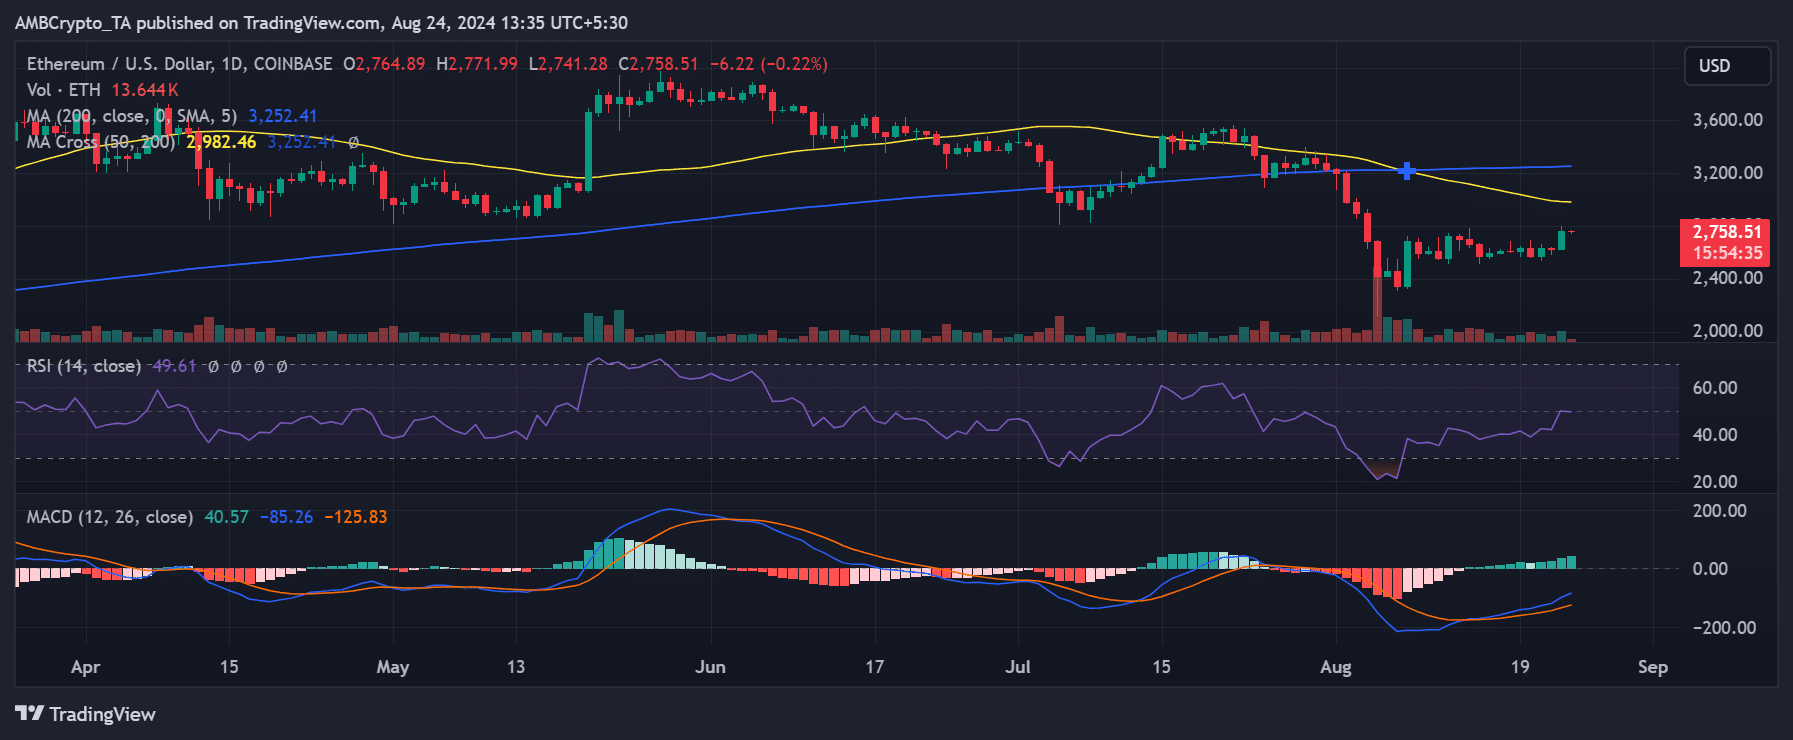
Source: TradingView
Specifically, Ethereum is still trading below both its short-term and long-term moving averages (yellow and blue lines). These moving averages are currently acting as strong resistance levels, preventing further upward movement in the price.
Additionally, Ethereum’s RSI seemed to be resting on the neutral line – A sign that it was neither overbought nor oversold.
– Read Ethereum (ETH) Price Prediction 2024-25
This positioning indicated that while Ethereum has seen a short-term price hike, it still faces significant resistance from its moving averages. A breakout above these resistance levels would be necessary to confirm the start of a more sustained bullish trend.


![Shiba Inu [SHIB] price prediction - Mapping short-term targets as selling pressure climbs](https://ambcrypto.com/wp-content/uploads/2025/03/SHIB-1-2-400x240.webp)