Ethena falls 12% and eyes $0.19 liquidity sweep – Yet ENA’s bullish outlook survives IF…
ENA’s next move may come from the $0.19 zone, not the trendline.



Ethena [ENA] shed 12.6% in 24 hours, but the move was not just another market pullback.
Daily trading volume rose 37%, while Open Interest dropped 16%, according to CoinMarketCap and Coinalyze data. This suggested that traders were taking risk off the table after ENA’s sharp two-week rally.
The selling came after Ethena climbed 118% in two weeks and reached $0.295 on the 27th of September 2026.
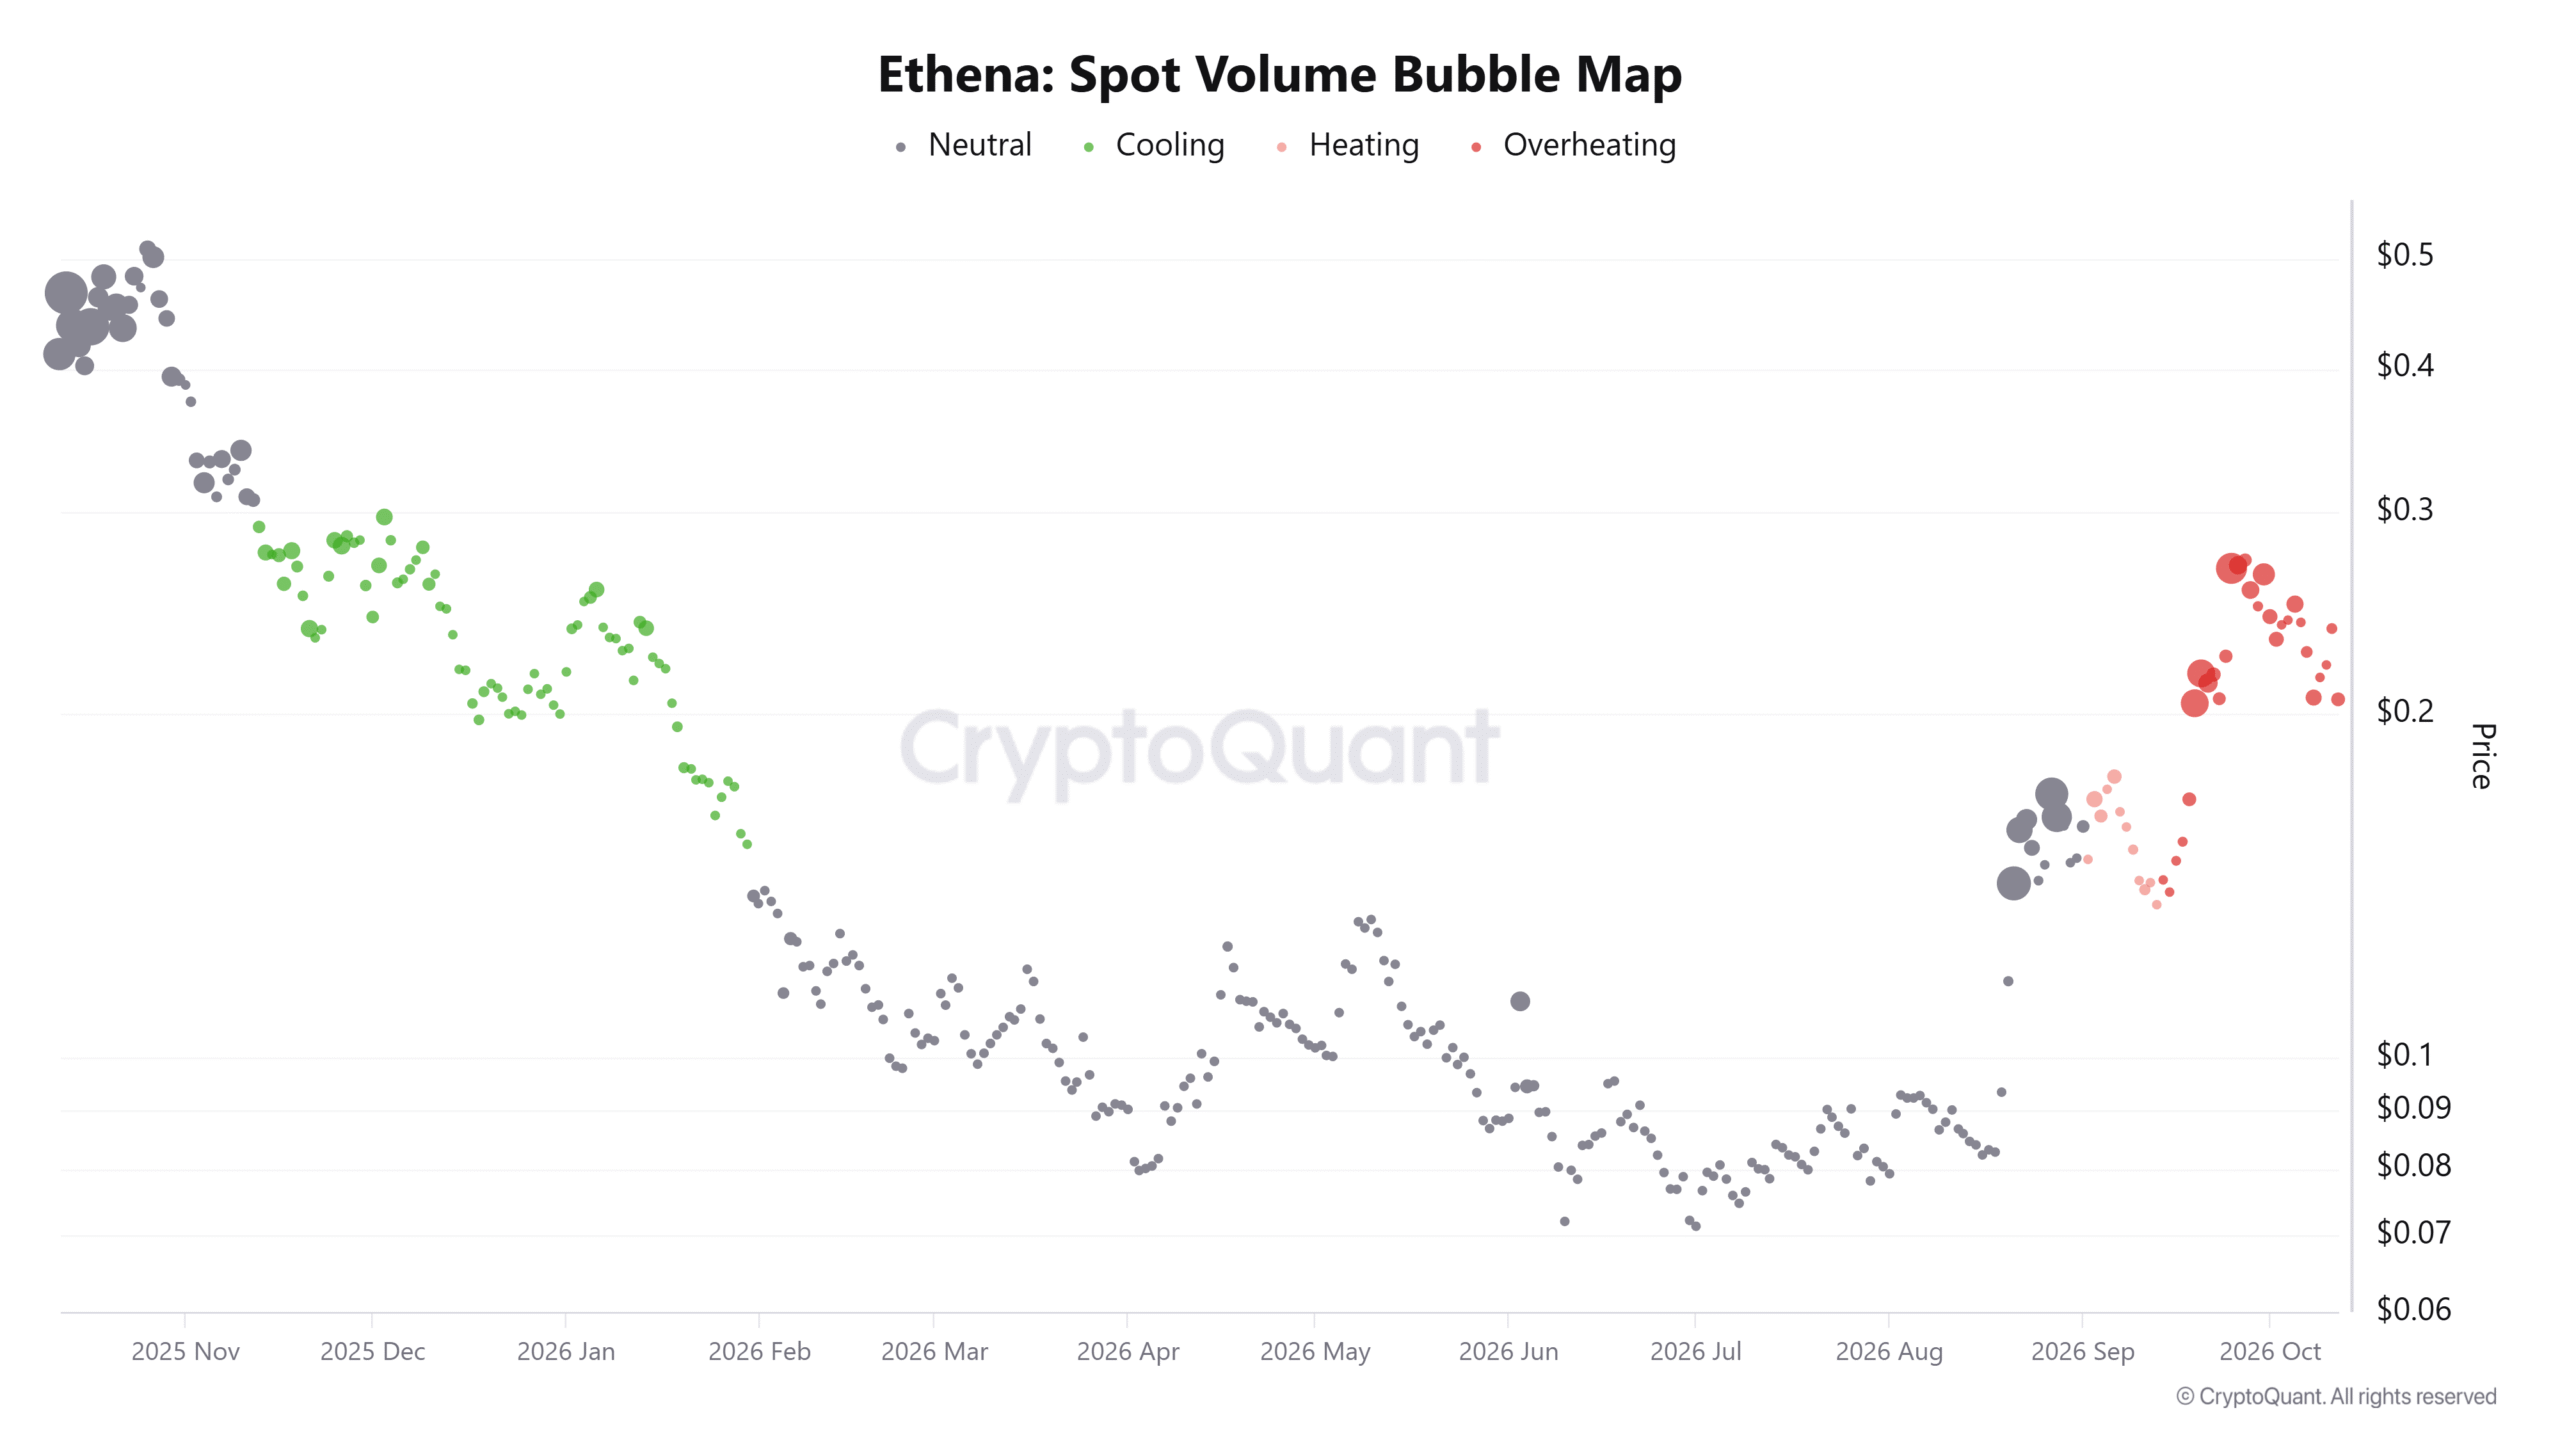
Over the past three weeks, Ethena’s Spot Volume Bubble Map flashed overheated conditions. The high rate of change in volume gave the first warning.
Meanwhile, weaker short-term price action over the past two weeks pointed to distribution.
So, the real question was simple. Was this the start of weakness, or just the market catching its breath?
Distribution trends could be a healthy reset for Ethena
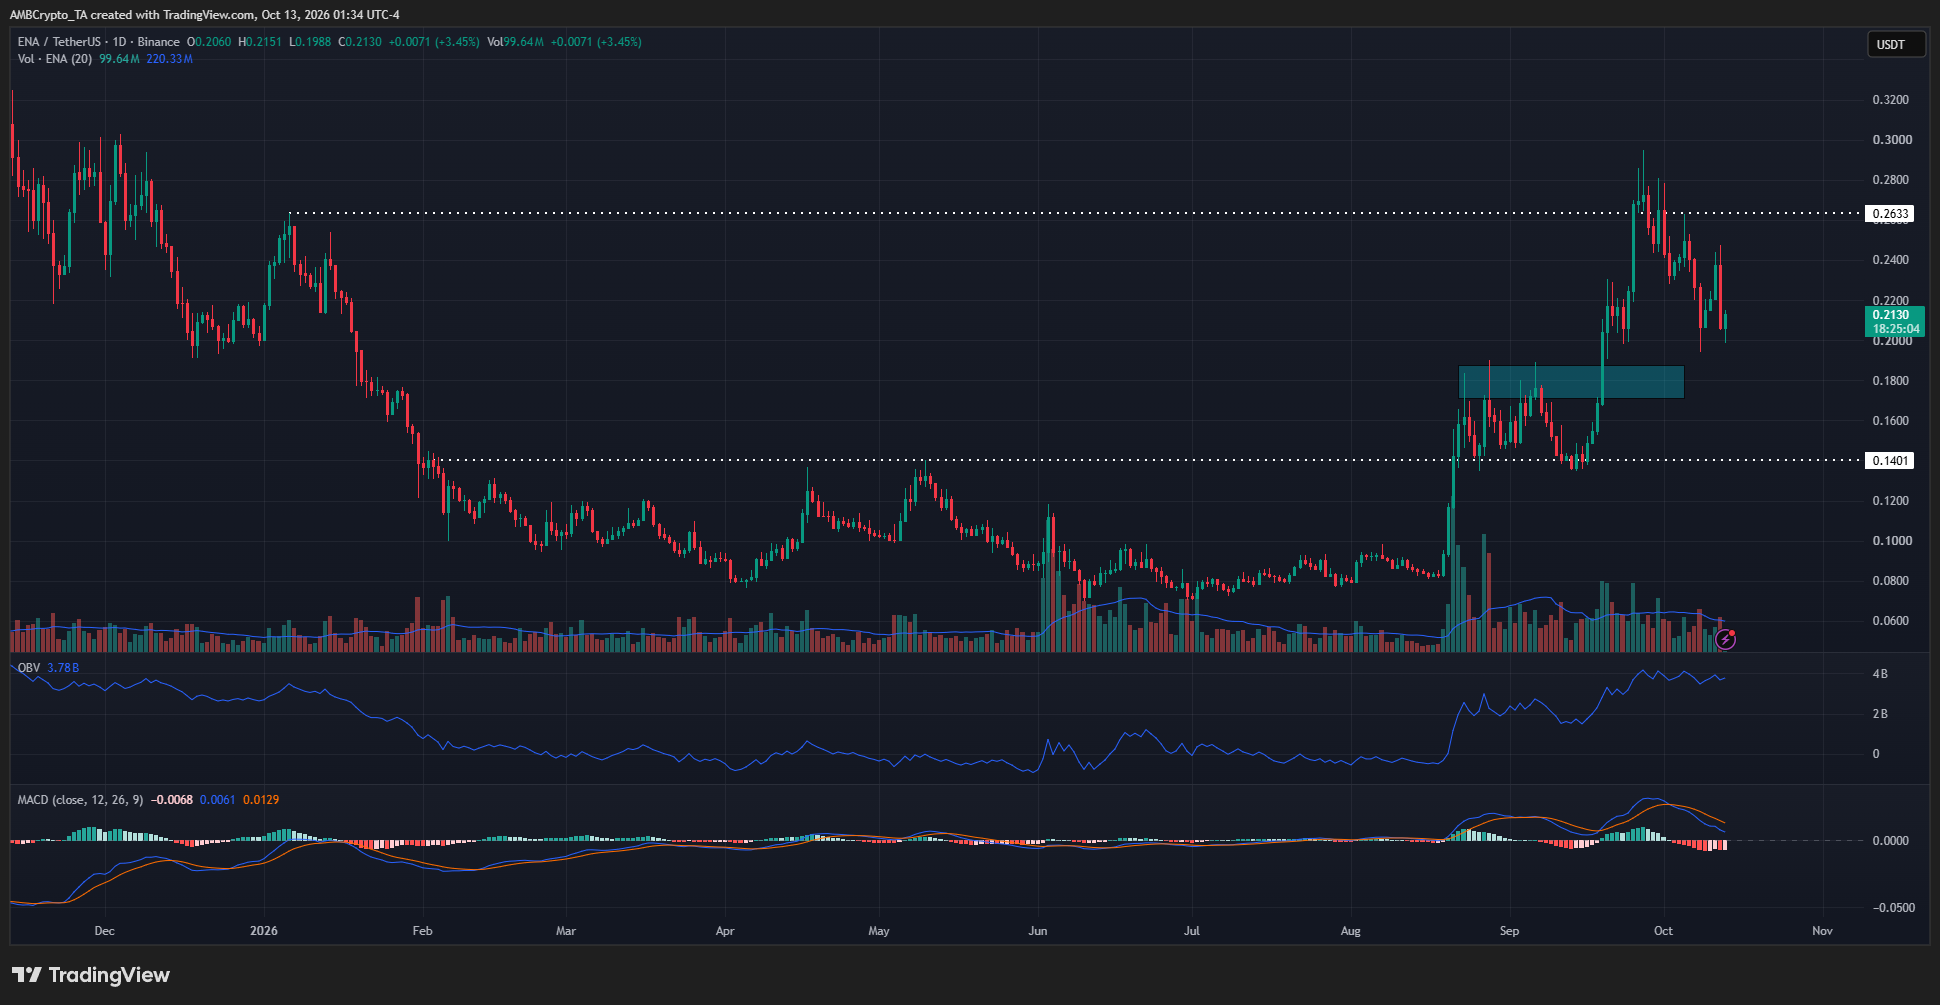
On the 1-day chart, the Ethena [ENA] price structure was firmly bullish. The $0.14 swing high made in May was flipped to support in August, and the $0.263 swing high from January 2026 has also been tested.
A daily session close above this swing high signaled a bullish continuation. Though Ethena prices have pulled back toward $0.20, the bullish price structure was intact.
The OBV has been steadily rising over the past two months, reacting to the surge in the average daily trading volume since August.
The MACD showed bearish momentum in recent days, but the indicator was still above the zero line, showing that a bullish trend was prevalent. A MACD bearish crossover would be an early hint of seller dominance.
Traders’ call to action- Stay bullish
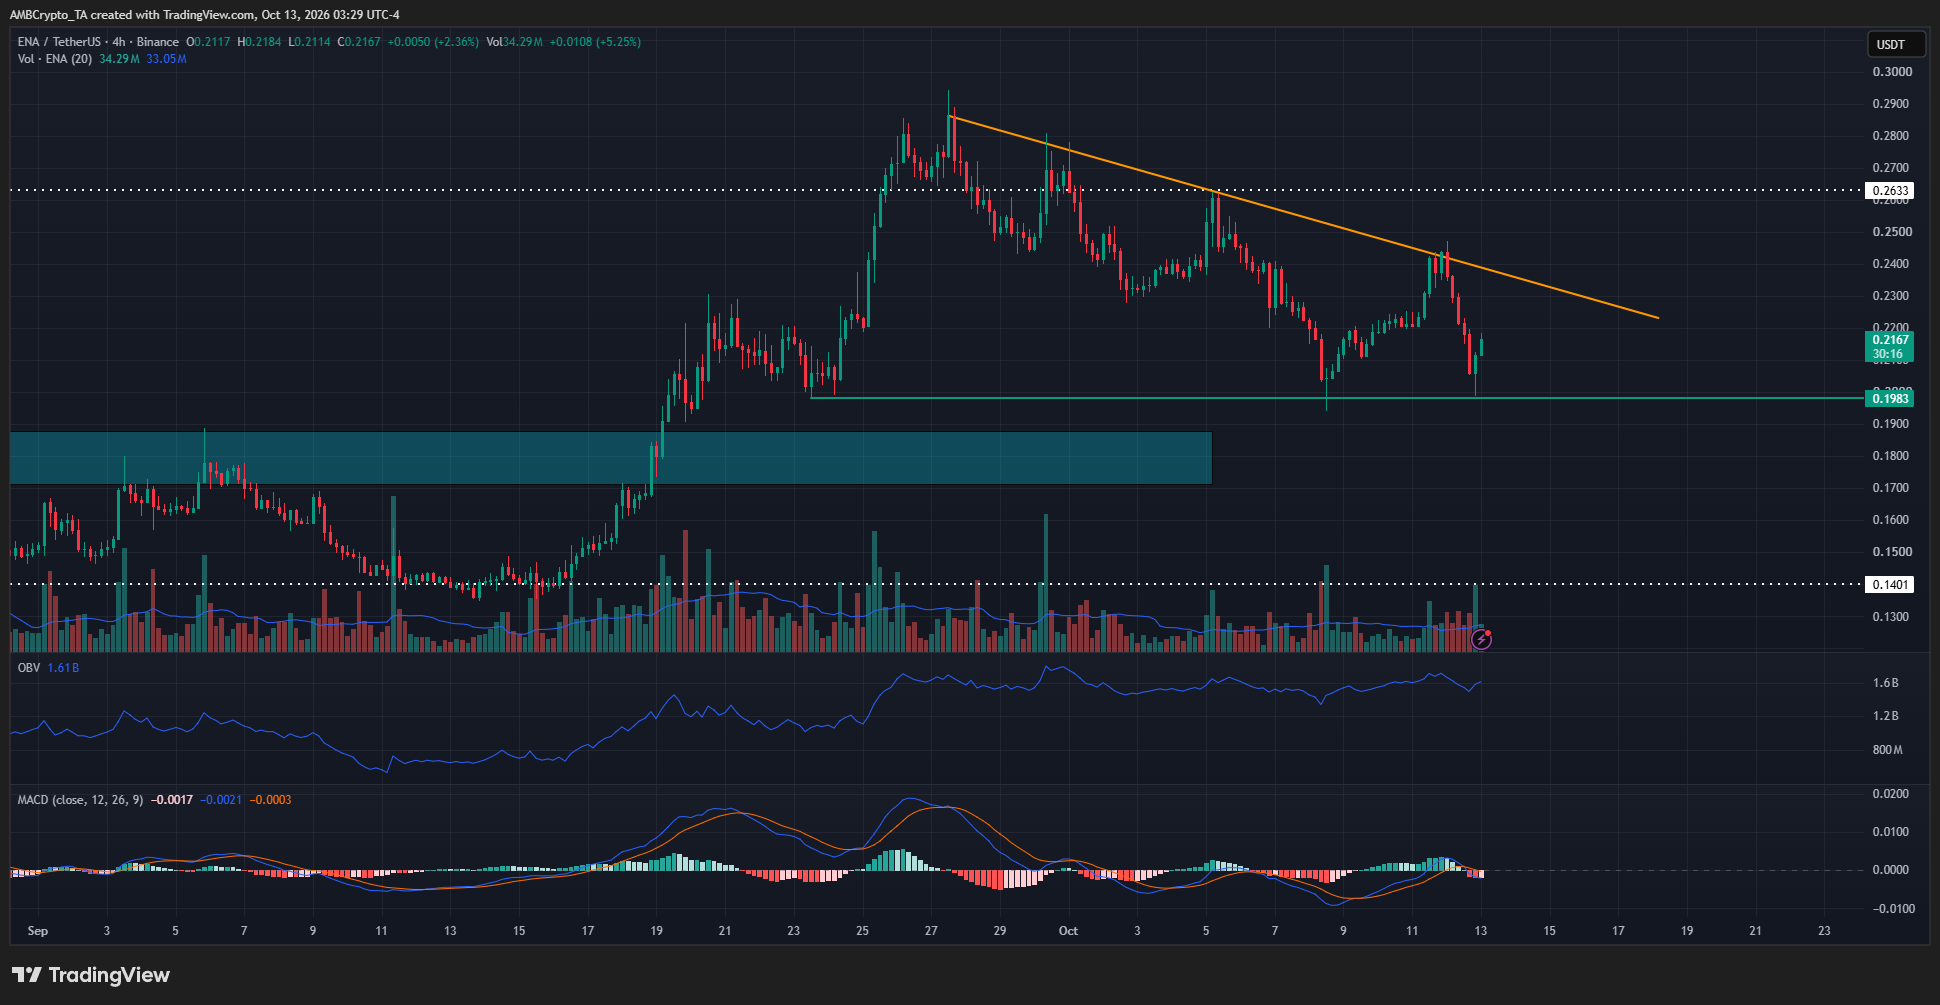
The $0.198 low on the 4-hour timeframe propelled a move past the $0.263 resistance. Despite the retracement since then, the local support just under $0.20 has been respected.
A breach of the falling trendline resistance (orange) would be a good sign for the bulls that the buyers have some say in the market.
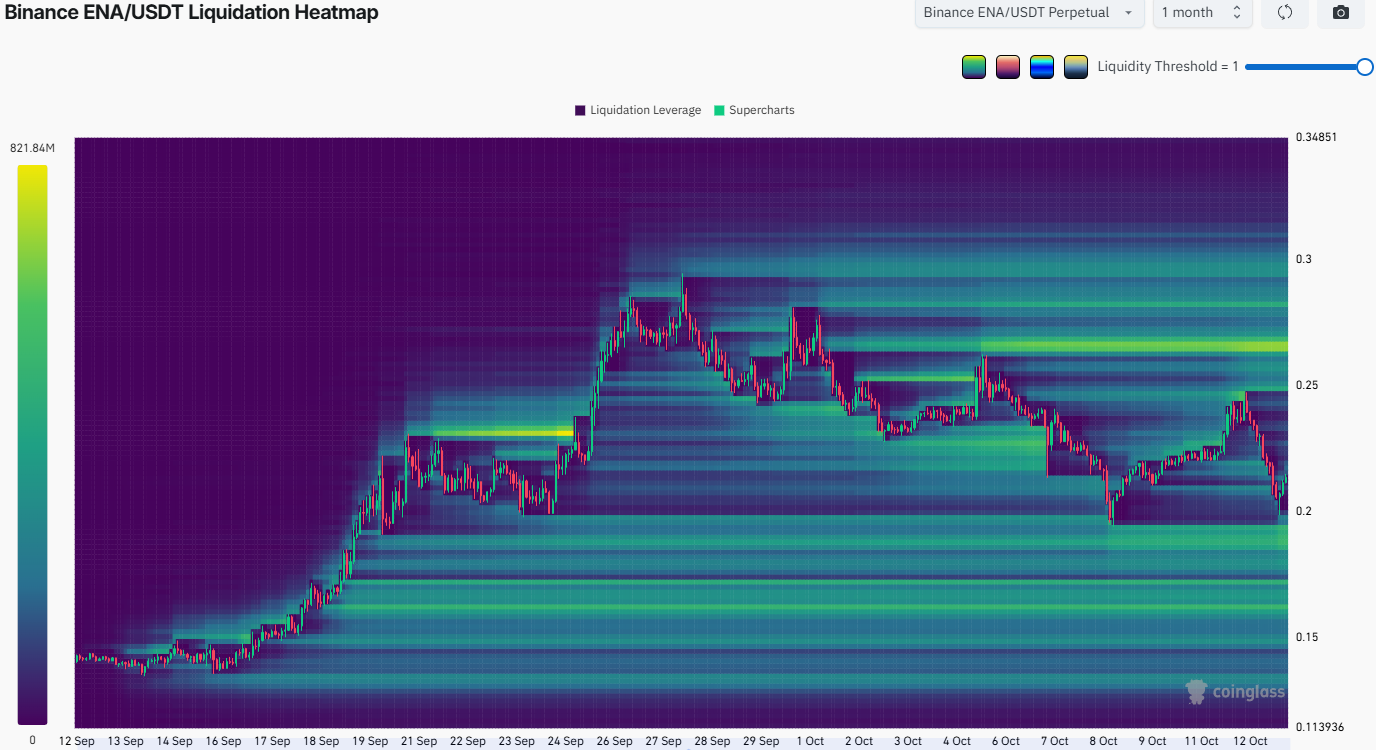
Before such a move higher, the $0.190 magnetic zone to the south is likely to act as a magnetic zone. A sweep of this area, just under the local support, and a bullish reaction from there would be another sign to the bulls that they can consider going long.
On the other hand, a sustained plunge below $0.17, especially if Bitcoin [BTC] corrects below $80k, could reflect panicked short-term market sentiment and weak buying.
Final Summary
- Ethena spot volumes indicated overheated market conditions and warned of a possible pullback.
- A sweep of the $0.19 magnetic zone is likely before a recovery past the descending trendline resistance, but a Bitcoin sell-off will affect ENA’s bullish prospects.