Ethena price prediction: Why ENA could rally 25% despite a long-term downtrend
Ethena has rallied 13% since Monday, and could rise by another 25% if the bulls have their way.



Ethena [ENA] has made some modest gains to get the week off to a good start. Since making the $0.078 low on Monday, July 20, the altcoin has rallied 13%. In the past 24 hours, its Open Interest has expanded by 7%.
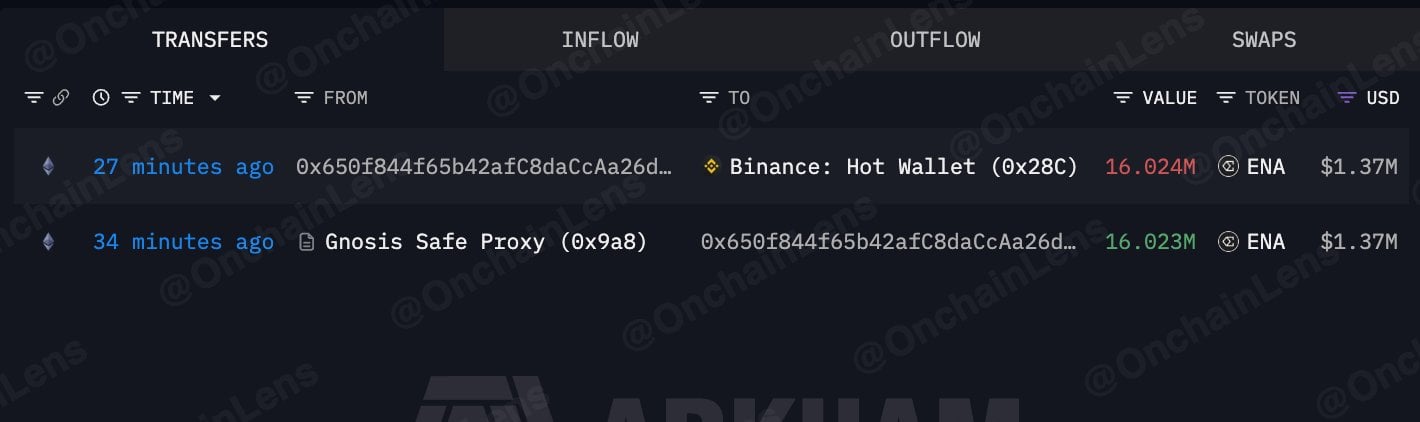
On July 21, Onchain Lens observed a 16 million ENA move, worth around $1.37 million. The wallet withdrew this from their Gnosis multisig wallet to Binance. Transfers to centralized exchanges generally point toward sell pressure.
Ethena holders have experienced profits, as seen on the daily transaction volume in profit metric. A rise in average order size also indicated potential whale interest in ENA, AMBCrypto reported.
ENA operates within a downtrend, but a temporary uptrend was underway
The $0.085 target presented has been met and cleared. However, the higher timeframe trend remained bearish.
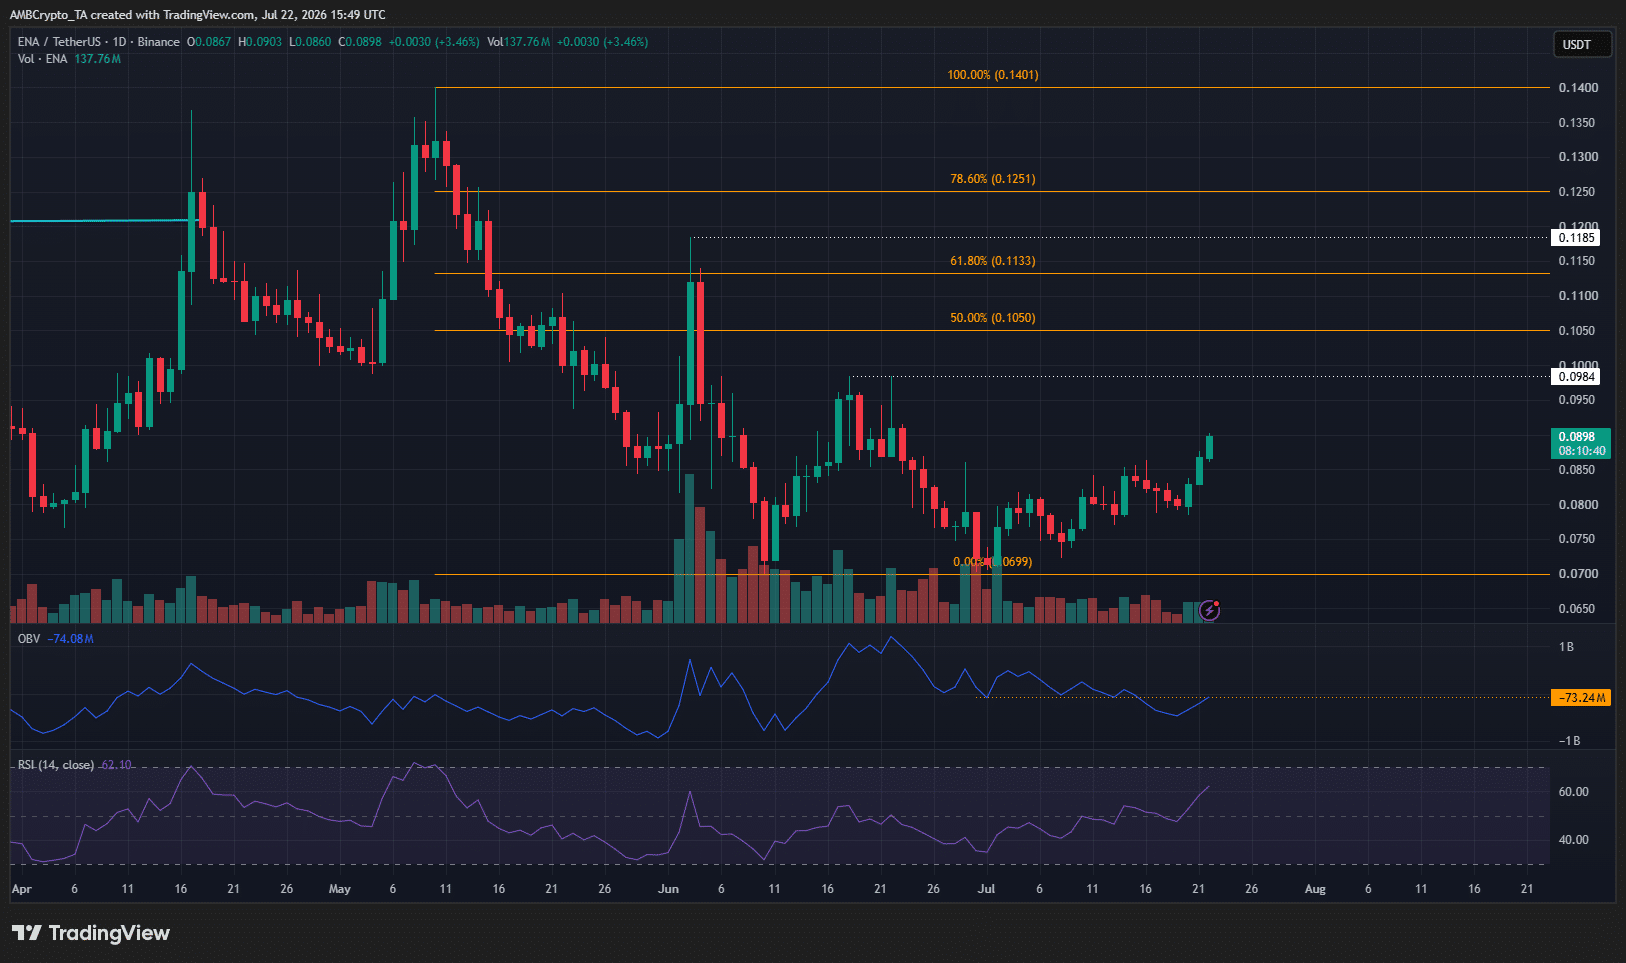
The local highs at $0.098 and $0.118 are the potential price targets in case of a short-term uptrend. As the Fibonacci retracement levels show, the swing structure on this timeframe was bearish.
A rally could rise to $0.123, but the likelihood of this had been in question as ENA repeatedly failed to breach the $0.085 resistance zone over the past three weeks. The gains at the start of this week were a positive sign.
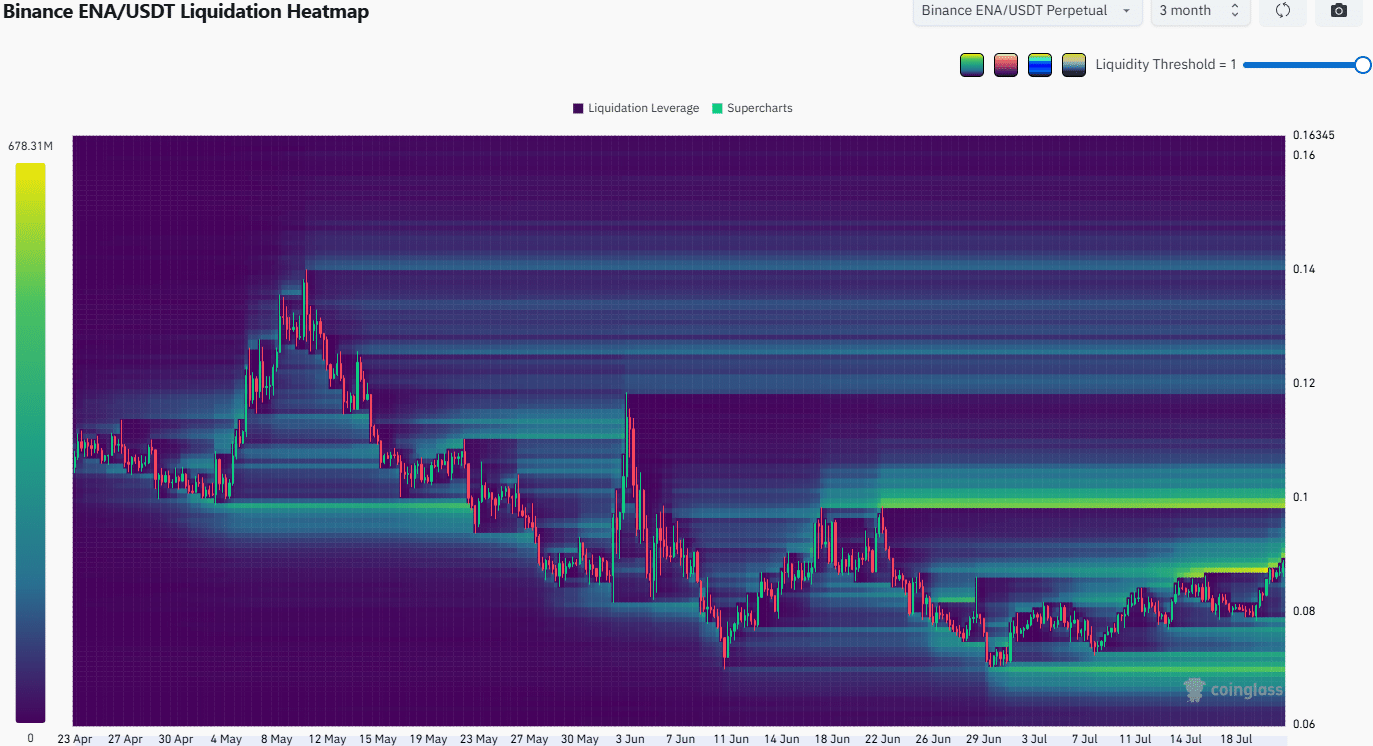
The liquidation heatmap of the past three months agreed. There were two magnetic zones to keep an eye on. The $0.09 and $0.10 had dense short liquidations that traders should keep an eye on.
Traders’ call to action- Cautiously bullish stance warranted
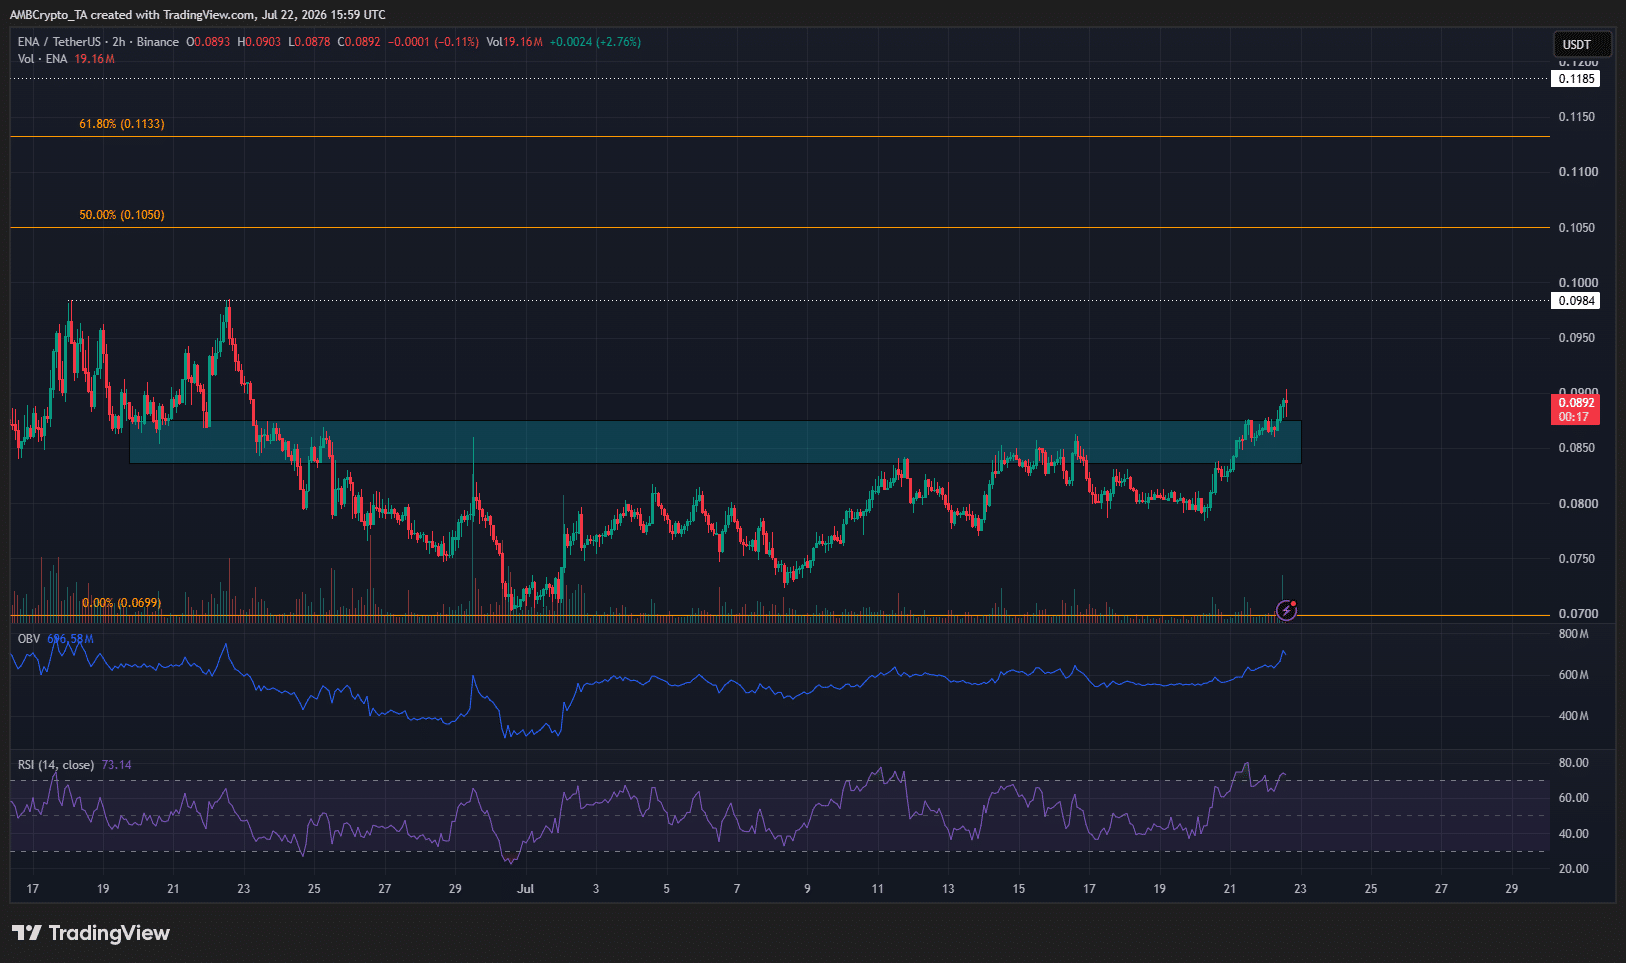
The $0.085 zone was flipped to support. The OBV was making new local highs to indicate increased buying pressure. The RSI showed strong bullish momentum, though a bearish divergence warned of a brief dip toward $0.085.
Such a dip would likely present a short-term buying opportunity. As noted earlier, the $0.098,$0.118, and $0.123 levels are viable targets for ENA in a pullback within its higher timeframe downtrend.
Final Summary
- The $0.085 local resistance zone was flipped to support, though a short-term RSI bearish divergence could cause a minor price dip.
- Traders can wait for the current upward move to push toward $0.11-$0.12 before looking to take profits. Bitcoin volatility could hurt this short-term setup.