Ethereum: $500M shorts wiped, bulls poised – Can ETH retain its stride?
Ethereum presented an attractive buying opportunity to investors, but it remained weak against Bitcoin.

- The Ethereum crossover above the weekly Moving Average has not yet occurred.
- The seller exhaustion constant fell to its 18-month lows, which could be a sign of a low-risk bottom.
Ethereum’s [ETH] short squeeze, on the 16th of June, saw $500 million in short liquidations. The flow of ETH into derivative exchanges was a signal that traders should beware of the potential for a deeper price drop and renewed selling.
Yet, with geopolitical tensions rising, Ethereum continued to trade above $2,400, and Bitcoin [BTC] above $100,000.
The drop in the estimated leverage ratio showed that the volatility earlier this week could serve as a good reset for the futures market, priming ETH for a recovery.
What would be the first sign of an Ethereum breakout?
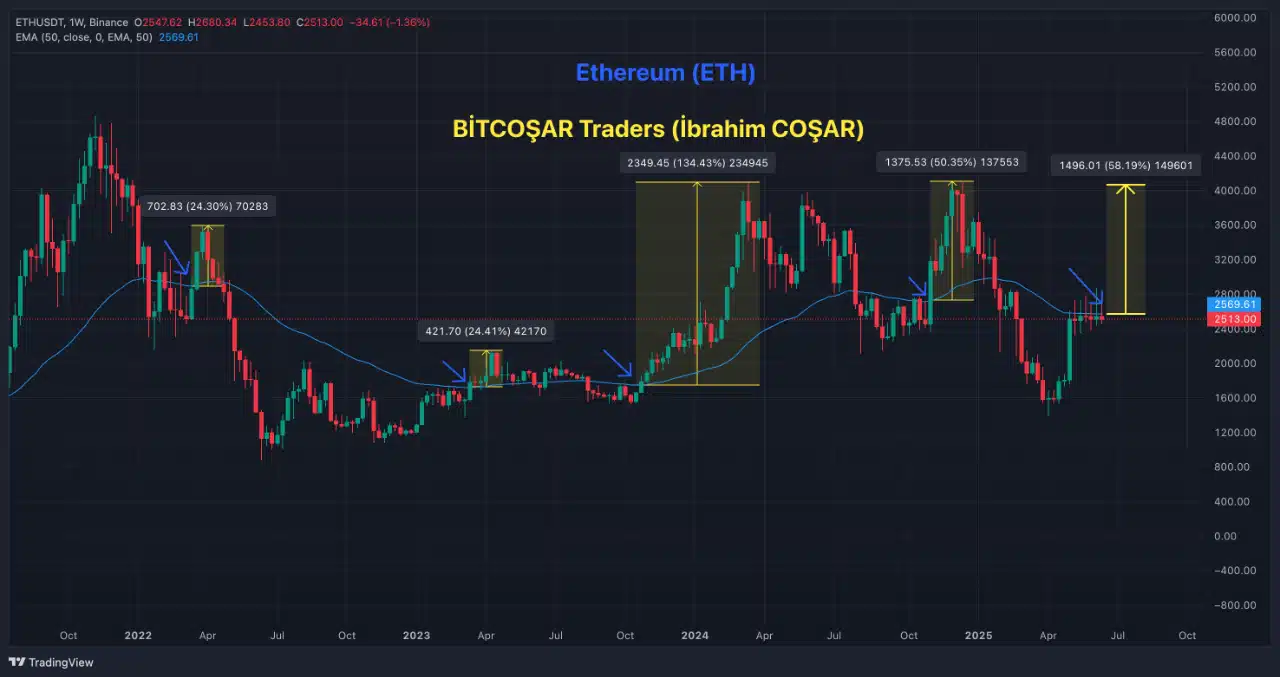
In a post on CryptoQuant Insights, user İbrahim Cosar observed that a decisive rally would first need to move past the 50-period Moving Average on the weekly timeframe.
The November 2024 and October 2023 rallies came after the ETH price breached this moving average.

The weekly price action showed ETH was coiled below the 50-week Moving Average, unable to climb above this resistance.
A weekly session close would highlight the strong chance of a bullish trend for Ethereum.

The seller exhaustion constant is the product of the percentage supply in profit and the 30-day price volatility. The combination of low percentage supply in profit (high losses) and low volatility would imply a low-risk bottom had formed.
The seller exhaustion constant has fallen below late-2024 levels, matching the January 2024 low.
This suggests Ethereum may have formed a high-probability bottom, despite trading above $2.4k within a range.

The ETH/BTC SOPR provided insight into the relative profitability of coins spent on both networks.
Consistent values below 1 meant investors realized heavier losses or fewer profits on their spent ETH than their equivalents on BTC.
It implied ETH weakness. The ETH/BTC saw a brief resurgence in April, but the SOPR showed that ETH continued to remain weak relative to BTC.


