
- ETF analyst believes there is hope for Ethereum ETFs after outflows reached $524 million.
- ETH price has plunged by nearly 6% amid an influx in selling activity.
Spot Ethereum [ETH] exchange-traded funds (ETFs) have recorded cumulative net outflows of $524 millio since they started trading on 23rd July. During the entire month of August, these products saw only seven days of positive inflows per SoSoValue.
The demand for these products continues to weaken given that on the 3rd of September, ETH ETFs saw $47 million in redemptions, marking the largest outflows in over four weeks.
The BlackRock iShares Ethereum Trust (ETHA) has recorded zero inflows in the last three trading days.
Bloomberg ETF analyst Eric Balchunas noted that unlocks from the Grayscale Ethereum Trust (ETHE) ETF were a “too powerful force” that dampened demand in August. However, once these outflows end, the ETFs could rebound.
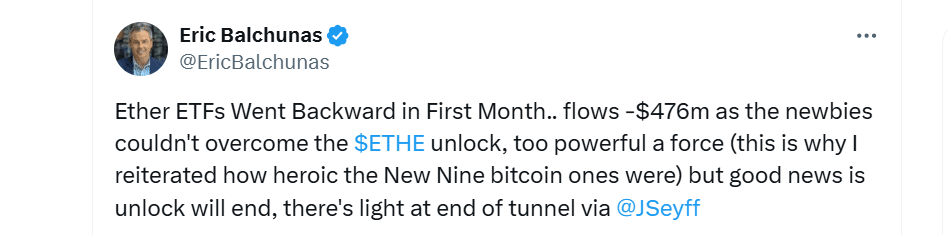
Source: X
However, Ether ETFs are not the only crypto products seeing weakened demand. Spot Bitcoin [BTC] ETFs have also posted consecutive outflows in the last five days.
How is ETH performing?
ETH price has borne the brunt amid the influx of outflows from Ethereum ETFs and a bearish sentiment across the broader market. In the last 24 hours, ETH has dropped by nearly 6% to trade at $2,368 at the time of writing.
The decline appears to come from selling activity. Data from CryptoQuant shows that between the 31st of August and the 3rd of September, over 257,000 ETH was sent to exchanges. This indicates an intent to sell.
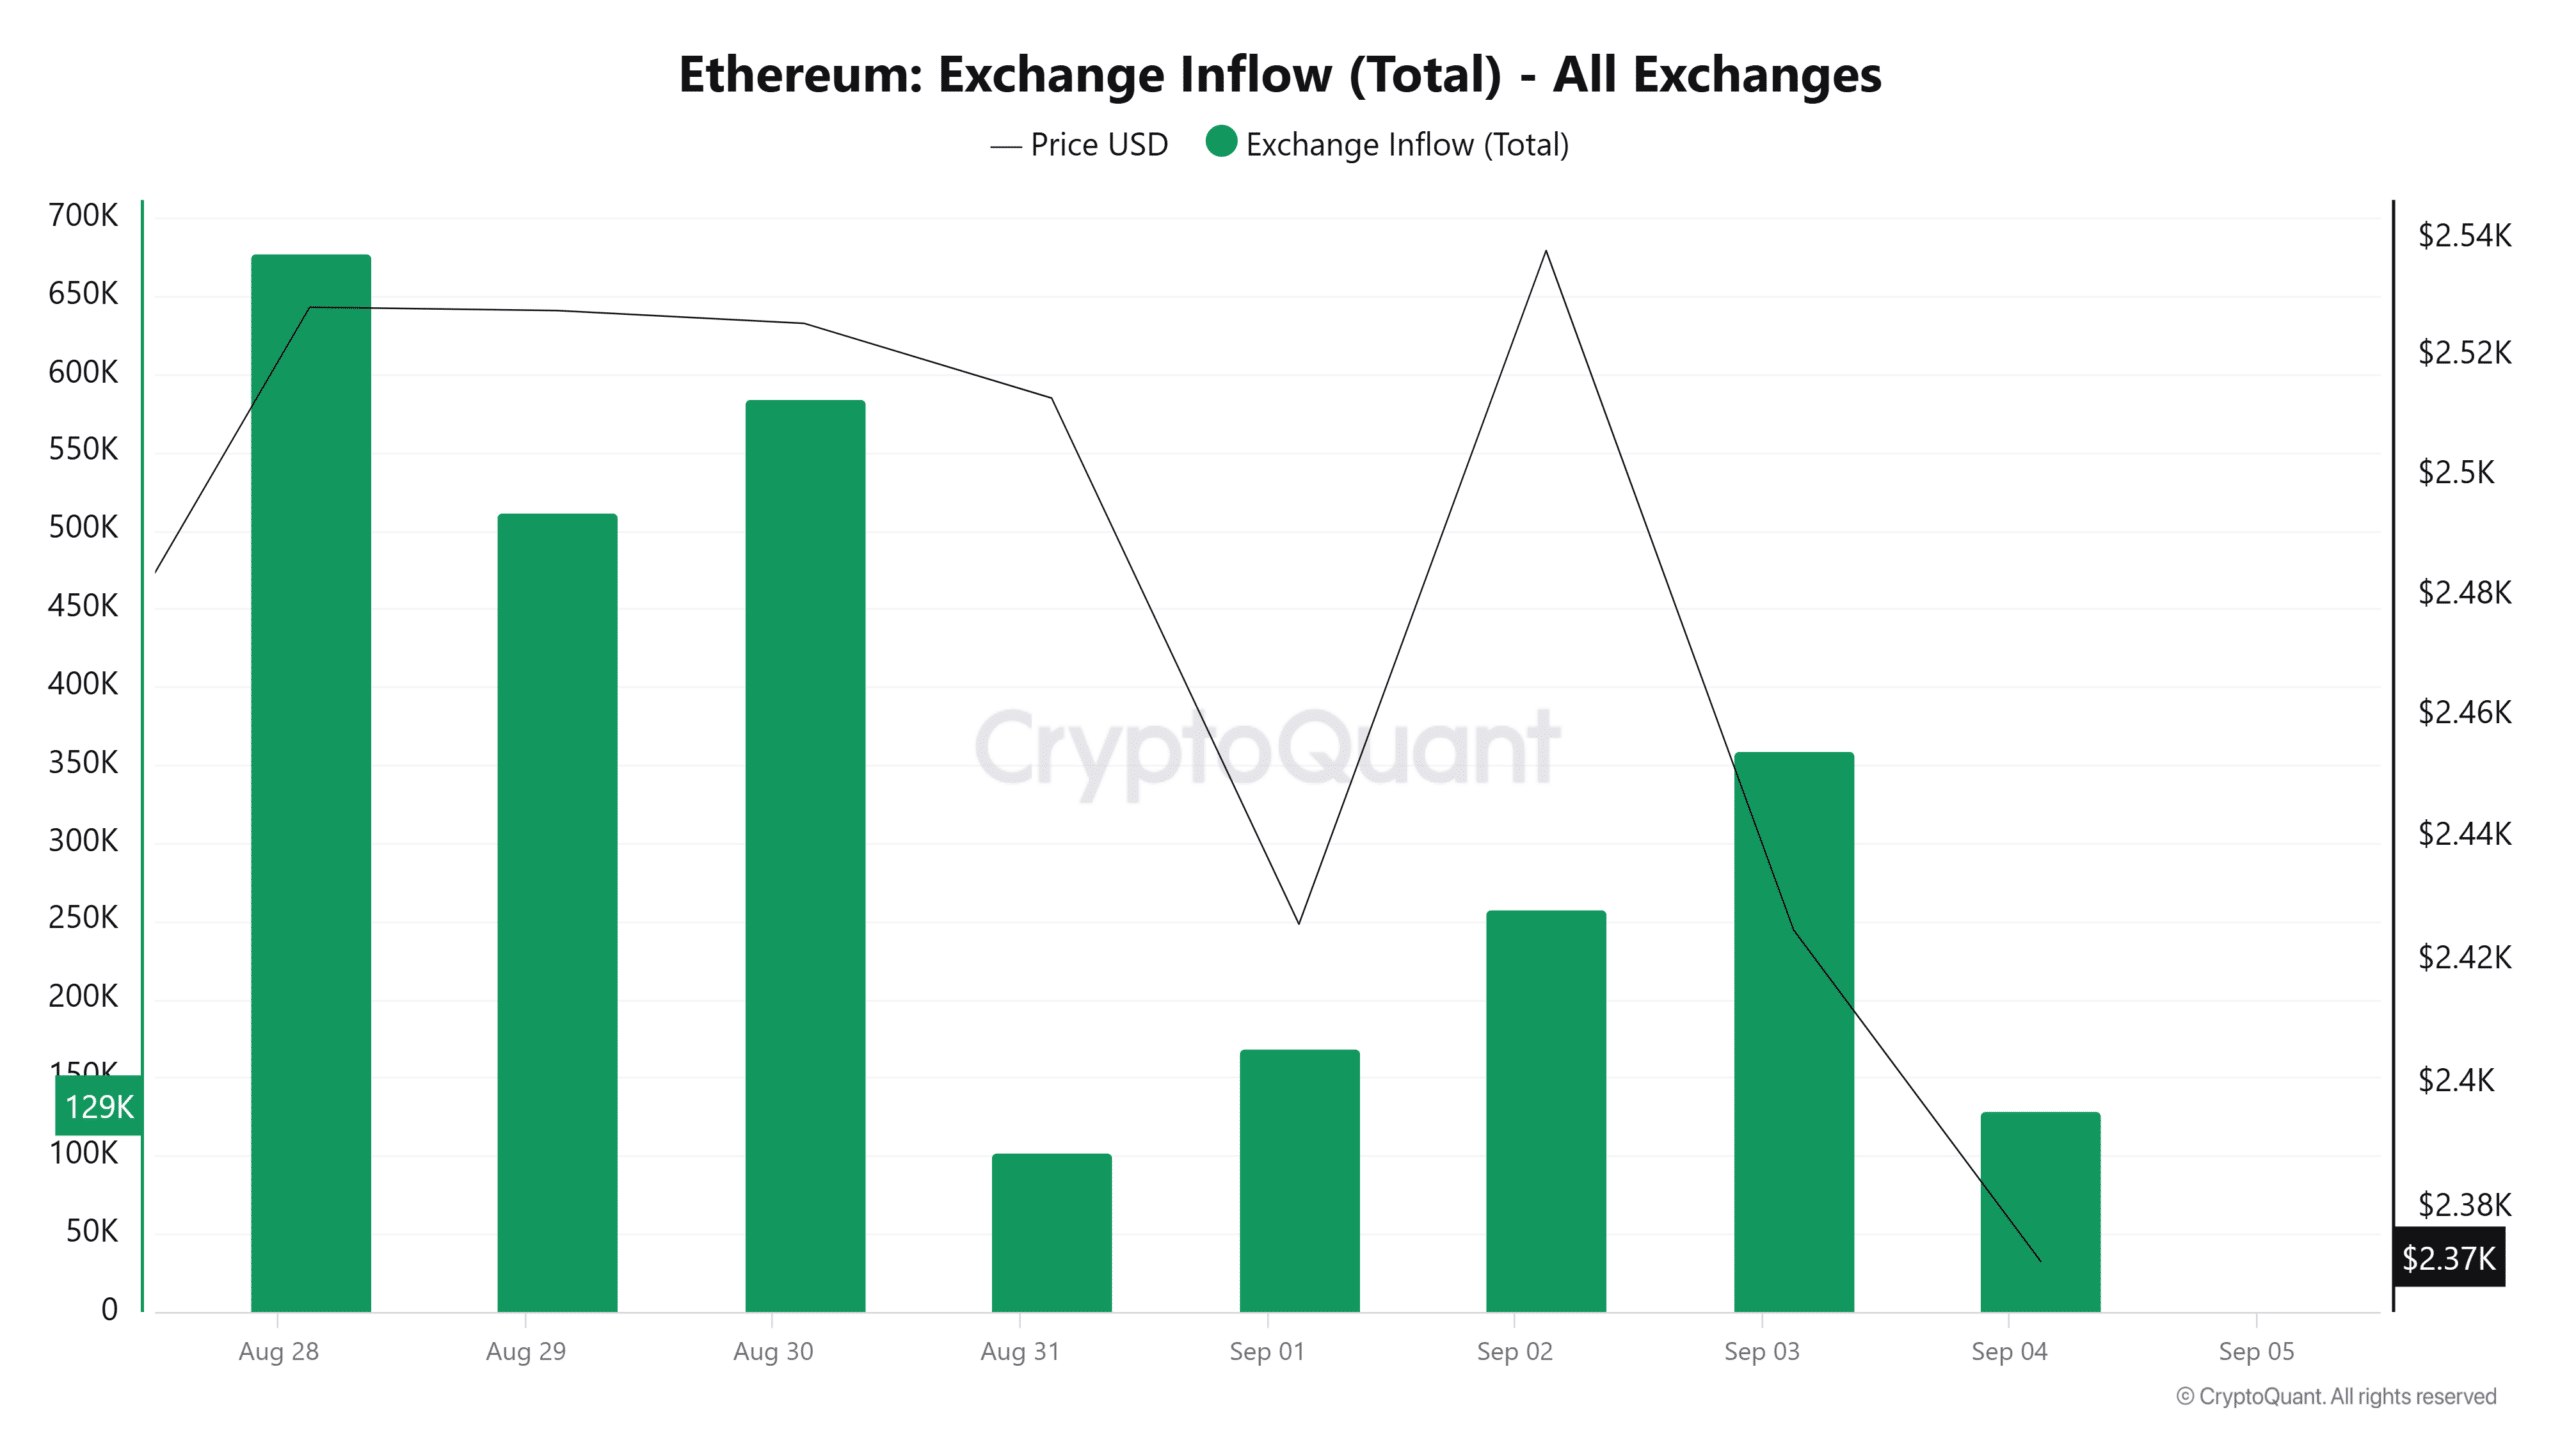
Source: CryptoQuant
Technical indicators are also showing an uptick in sellers after the Chaikin Money Flow (CMF) indicator flipped to the negative region after a brief period of buying activity.
Moreover, the Moving Average Convergence Divergence (MACD) line has been treading below the signal line over the past week, while the histogram bars have turned red. This also shows selling momentum.
Sellers might have flocked to the market after ETH failed to hold a critical support level at the 0.382 Fibonacci ($2,405). However, the altcoin has found another support level at $2,367, but a liquidity sweep below this price to $2,306 remains possible.
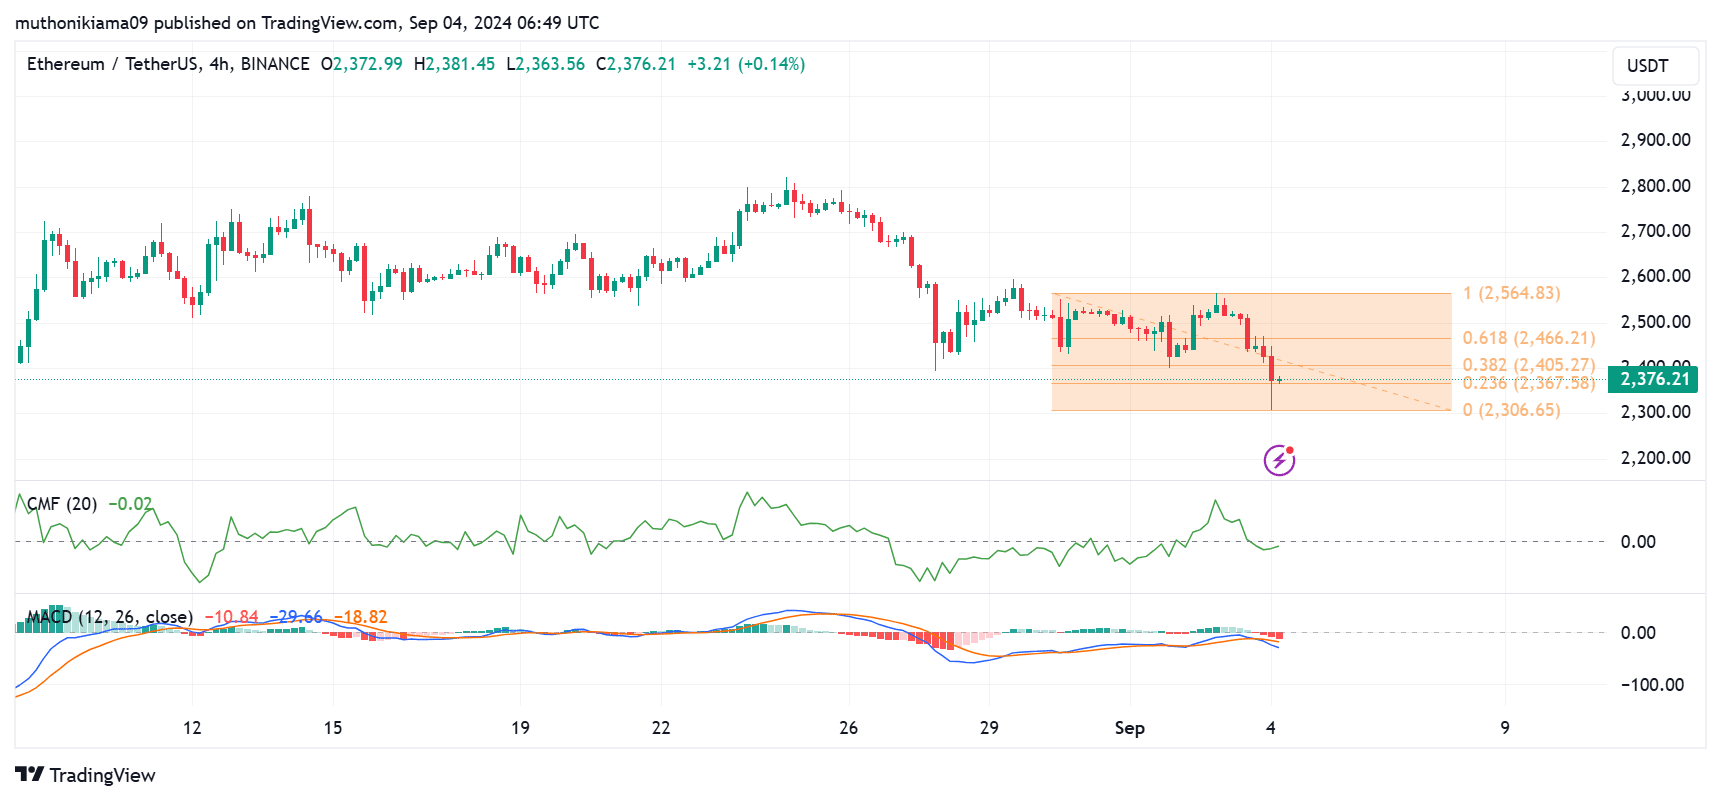
Source: Tradingview
Data from Hyblock Capital also revealed a large number of liquidations if the price falls to $2,280. Therefore, this price acts as another crucial support level at which buyers might choose to enter the market.
ETH needs to break past resistance at $2,466 to confirm a bullish reversal.
Read Ethereum’s [ETH] Price Prediction 2024–2025
The Ethereum network is struggling to support a price increase as the number of active addresses continues to decline. These addresses have dropped by nearly half since mid-August per CryptoQuant.
As network activity falls, ETH needs support from the broader market and a rise in market interest for a steady uptrend.