


The altcoin market has performed strongly in the past week, with Ethereum gaining nearly 15%. Axie Infinity, Cosmos, and Decentraland all followed the footsteps of Bitcoin and ETH and flipped former near-term resistance areas to support.
Ethereum (ETH)
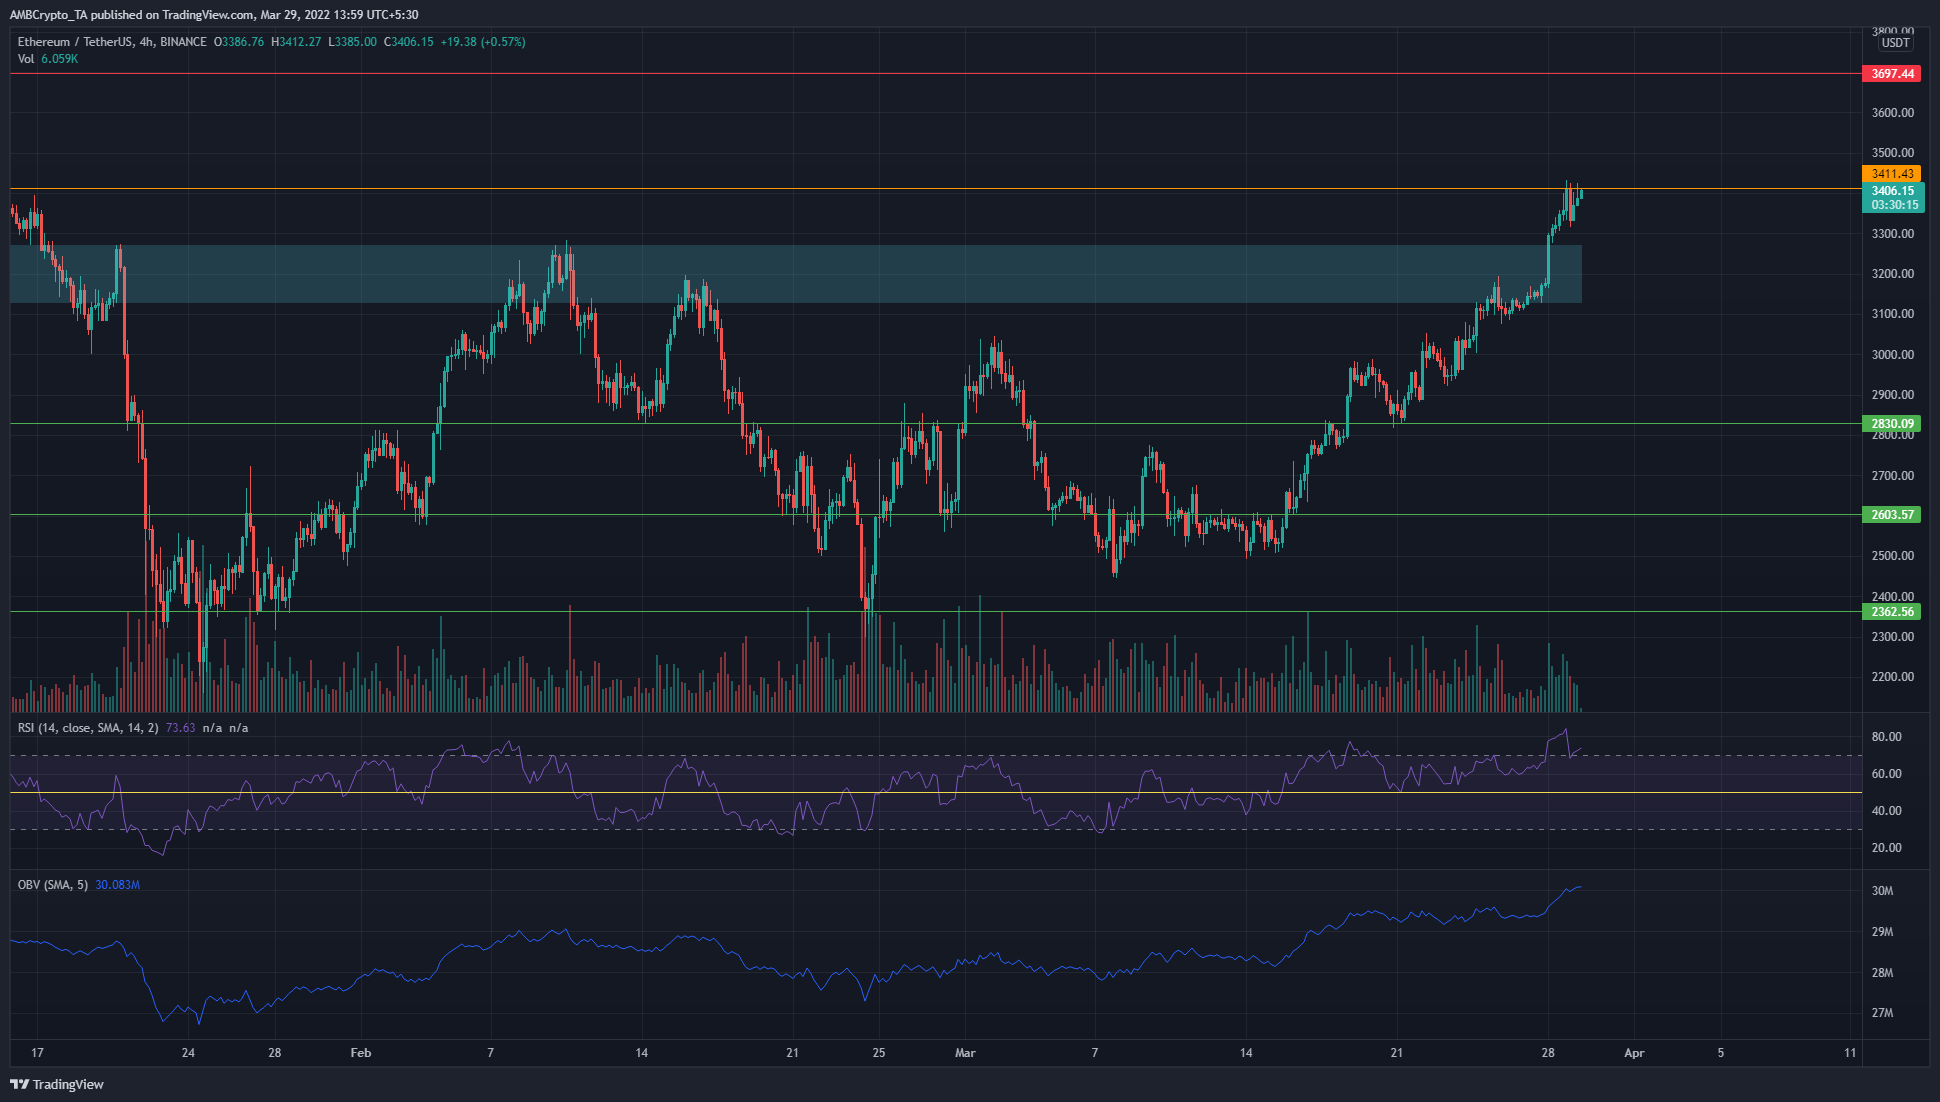
At $3411, in orange, lies a level that marked yet another swing high on ETH’s downtrend. This level was a lower high, registered in mid-January. In the months since then, the price has retested the $3200 area as a zone of supply.
Only in the past few days has ETH been able to push past the $3200 area and retest it as a demand zone. Moreover, on the 4-hour chart, the RSI continued to show strong bullish momentum and was in overbought territory with a value of 73.6.
The OBV was also rising, and momentum could see Ethereum climb past $3411. This would be yet another sign of near-term bullish strength. $3650-$3700 is the next resistance area.
Axie Infinity (AXS)
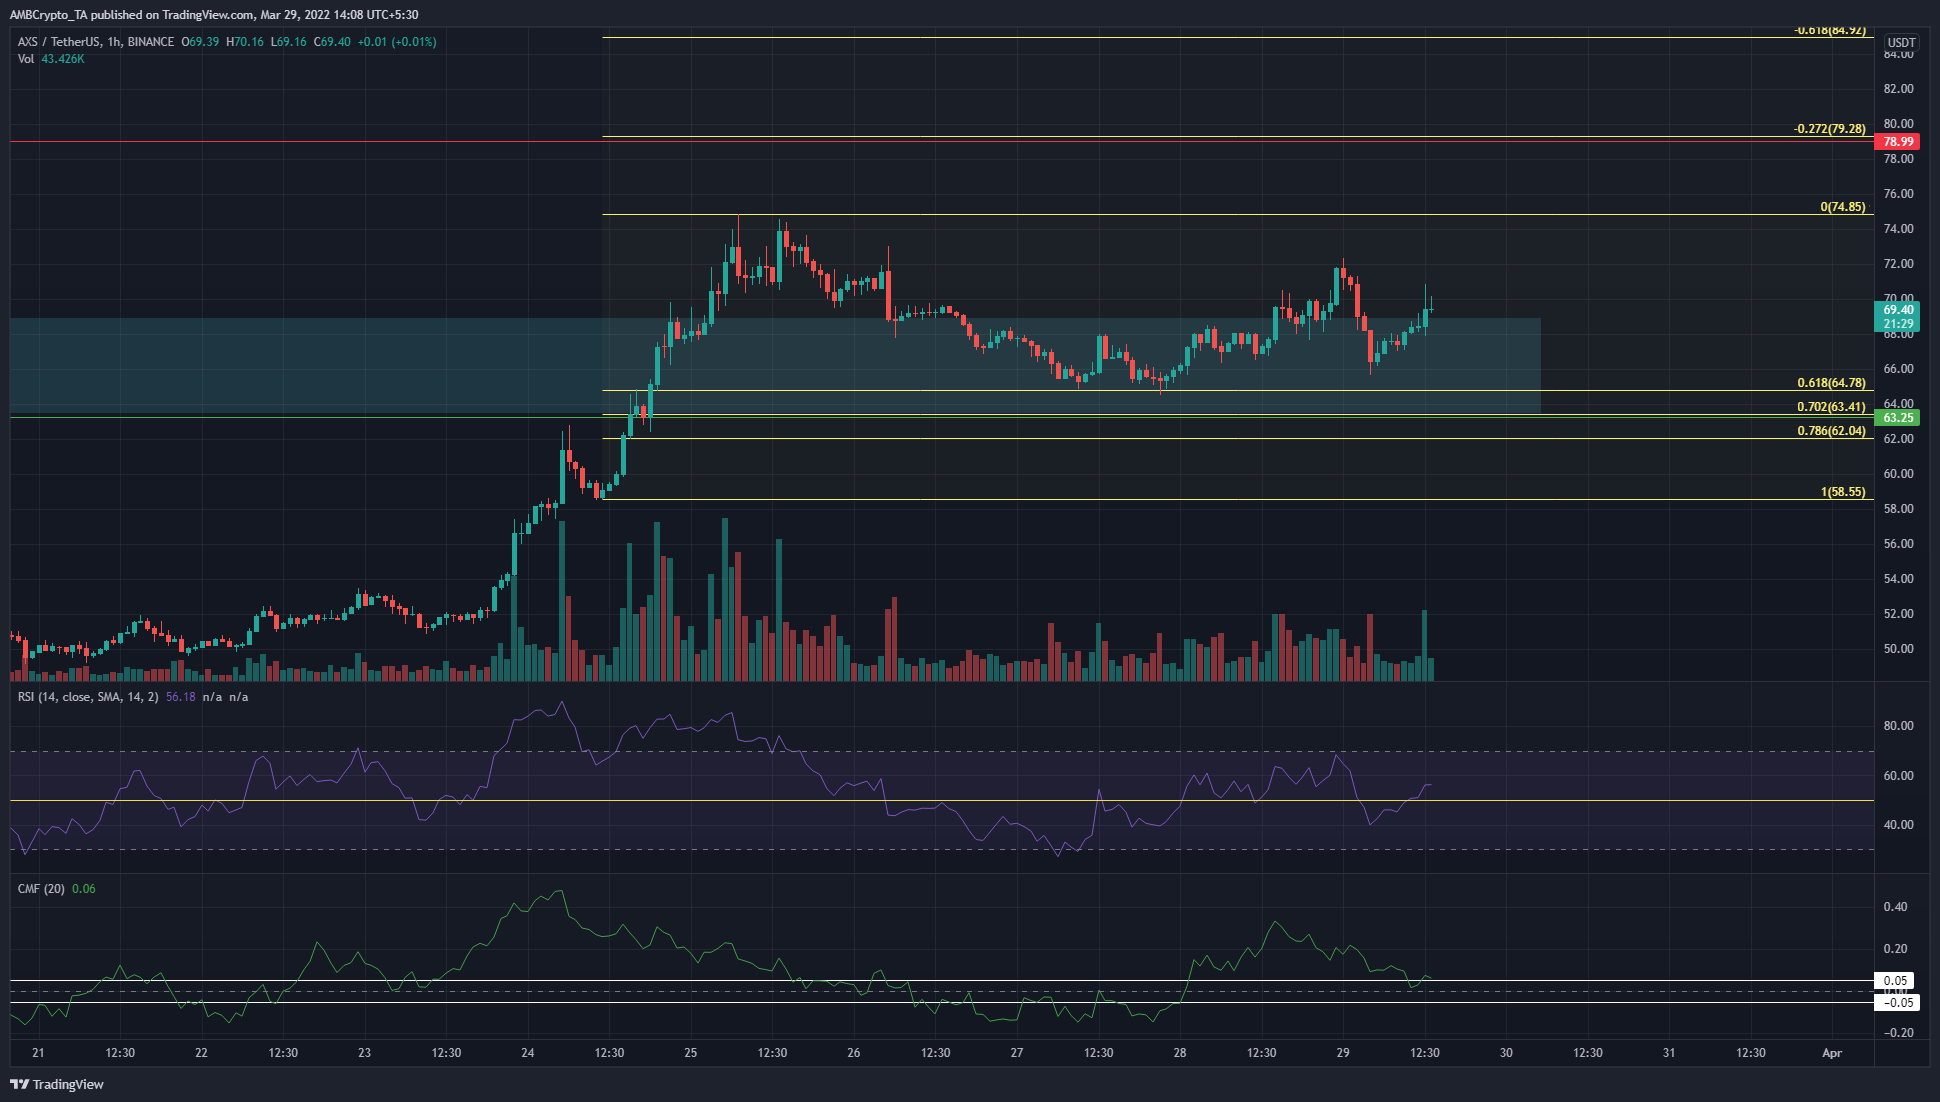
A set of Fibonacci retracement levels were drawn based on AXS’ move from $58.55 to $74.85. The 61.8% retracement level for this move lay at $64.78, and it has been tested as a support level. Moreover, the $63-$67 area (cyan box) is an area of former supply, and AXS has likely flipped it to demand.
The RSI climbed past neutral 50 once more as bullish momentum gathered, and the Chaikin Money Flow was at +0.06 to show significant buying pressure in the market.
Cosmos (ATOM)
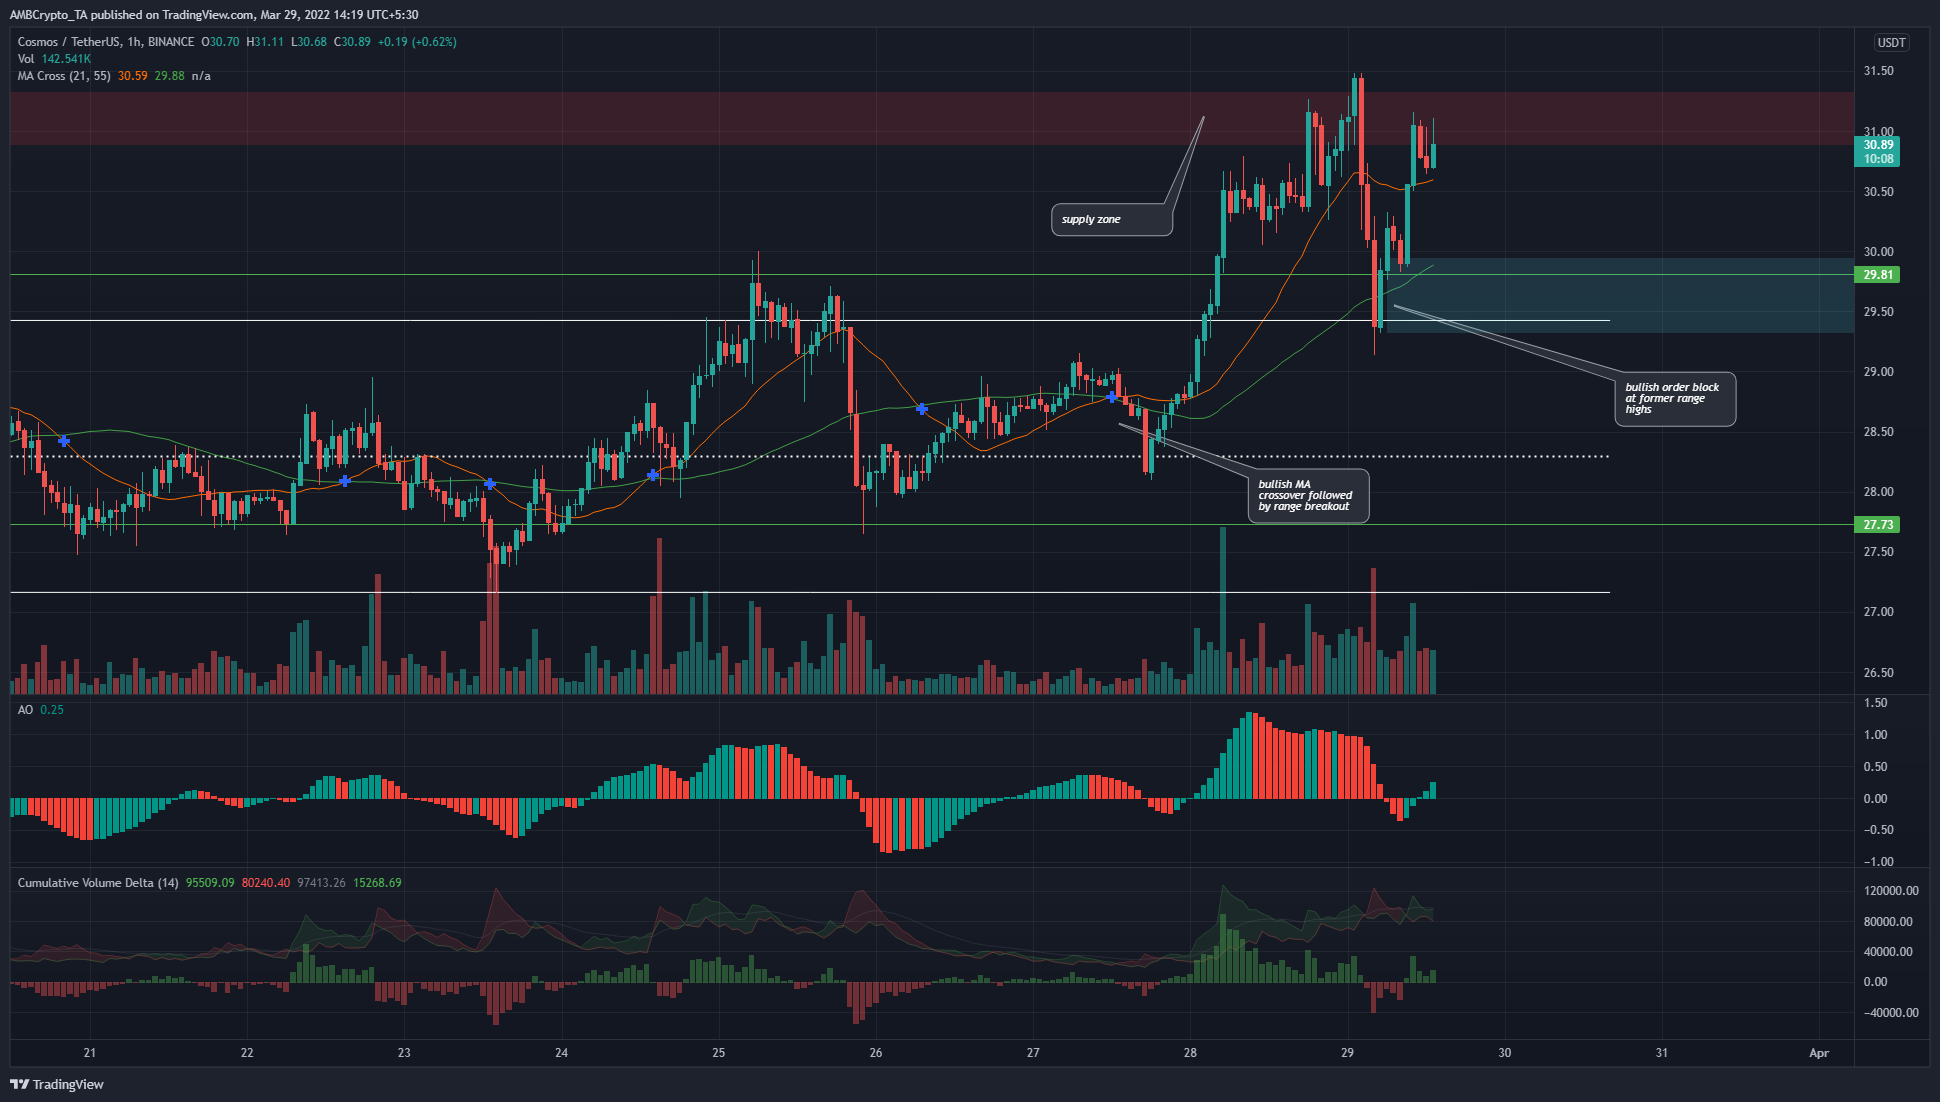
ATOM formed a near-term range from $27.2 to $29.4 (white), and in the past few days, the price has attempted to break out of this range and succeeded. Moreover, it established a bullish order block in the $29.5 area (cyan), which meant a revisit to this area could present buying opportunities.
There was also a zone of resistance in the $31 area (red box). The Awesome Oscillator crossed over above the zero line to show bullish momentum was rising once again, while the CVD also registered green bars to show demand was picking up.
Decentraland (MANA)
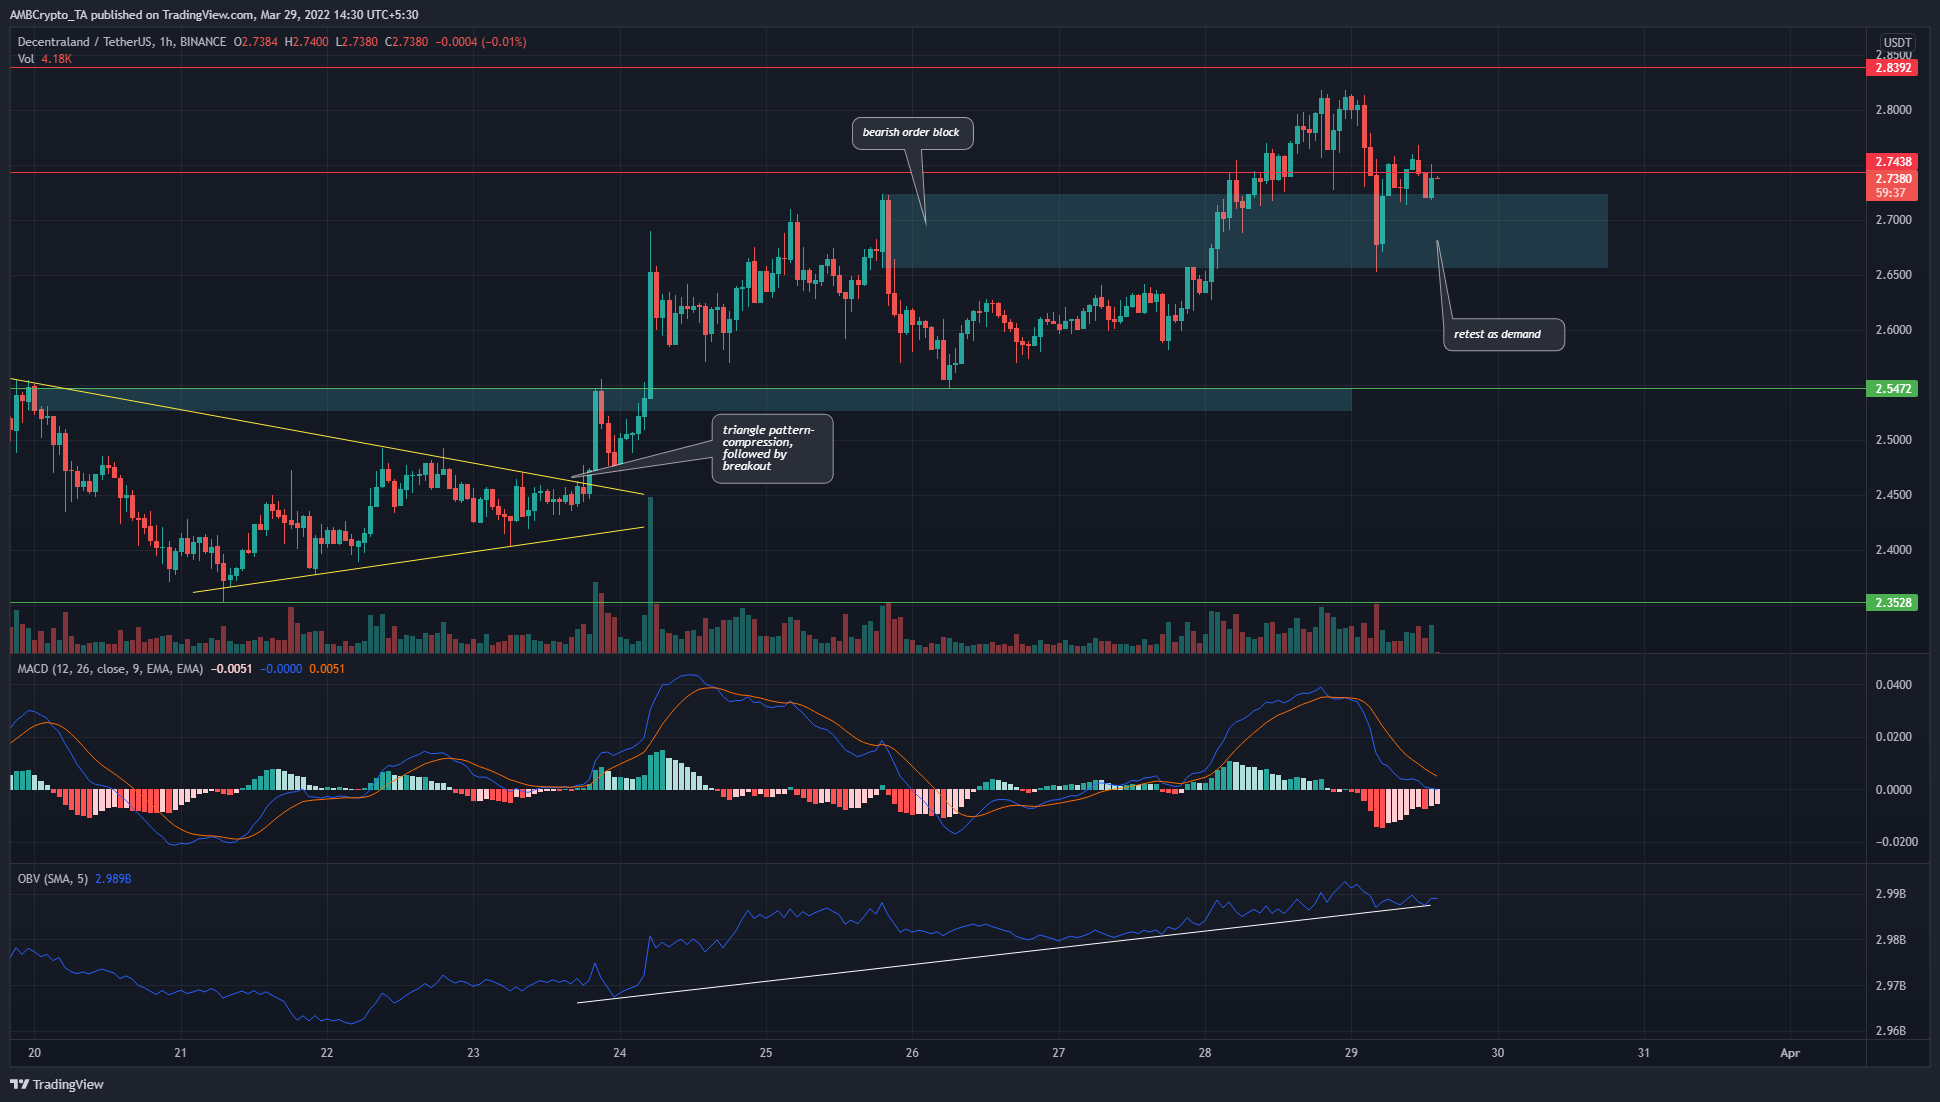
MANA was another coin that was retesting a former area of resistance as demand. At $2.7 and $2.54 rested areas where sellers had been strong in recent weeks. However, in the past week, the price formed a compression and broke out past both these areas. In the next couple of days, another move northward could be witnessed.
While the MACD was dipping in response to the sharp pullback from $2.8, the OBV continued to form higher lows. This meant buying volume was steady and stronger than selling.