Ethereum

Ethereum’s price below 3K! How long should you wait before the next rally?
Posted:
| Last updated: June 6th, 2024

- ETH’s price dropped under $3000 on the 30th of April.
- The decline will likely continue if bearish momentum climbs.
Ethereum’s [ETH] brief decline below $3000 during the trading session on the 30th of April led to a spike in its social activity, Santiment noted in a post on X (formerly Twitter).
🗣️ #Bitcoin and #Ethereum are seeing significantly higher discussion compared to other assets today. Traders have showed a sizable amount of fear with $BTC dropping as low as $59.5K and $ETH as low as $2.9K today. Counter traders have used these signs as a great #buythedip… pic.twitter.com/6pRAFHidcD
— Santiment (@santimentfeed) April 30, 2024
According to the on-chain data provider, at the time of press, the altcoin ranked second in terms of social discussion after Bitcoin [BTC].
Between the 29th and the 30th of April, ETH’s social dominance skyrocketed by 150% as the chatter involving the coin across Telegram, Reddit, X, and 4Chan increased.
To rise or fall?
Generally, when an asset’s price decline is followed by a surge in social activity, it often signals an impending price correction.
However, a look at the coin’s price movements on a daily chart suggested that ETH might not be poised for any significant rebound in the short term. Its price may even witness further downside.
Readings from the coin’s Fibonacci Retracement levels showed that ETH’s decline below $3000 marked a breach of an important support level, which it had formed at $3145 over the past few weeks.
Exchanging hands at $2,899 at press time, the likelihood of a further decline remains high as demand for the leading altcoin continues to plummet among market participants.
For example, ETH’s key momentum indicators were positioned below their respective center lines at the time of press. Its Relative Strength Index (RSI) was 45.31, while its Money Flow Index (MFI) was 40.50.
At these values, the indicators signaled a preference for coin distribution over accumulation.
Further, the coin’s MACD line (blue) rested below its signal line (orange) and approached the zero line at press time.
When an asset’s MACD line rests below its signal line, it indicates a rise in bearish momentum. This means that the asset’s price could be in a downtrend or that it is expected to experience downward pressure soon.
Traders often interpret it as a potential sell signal.
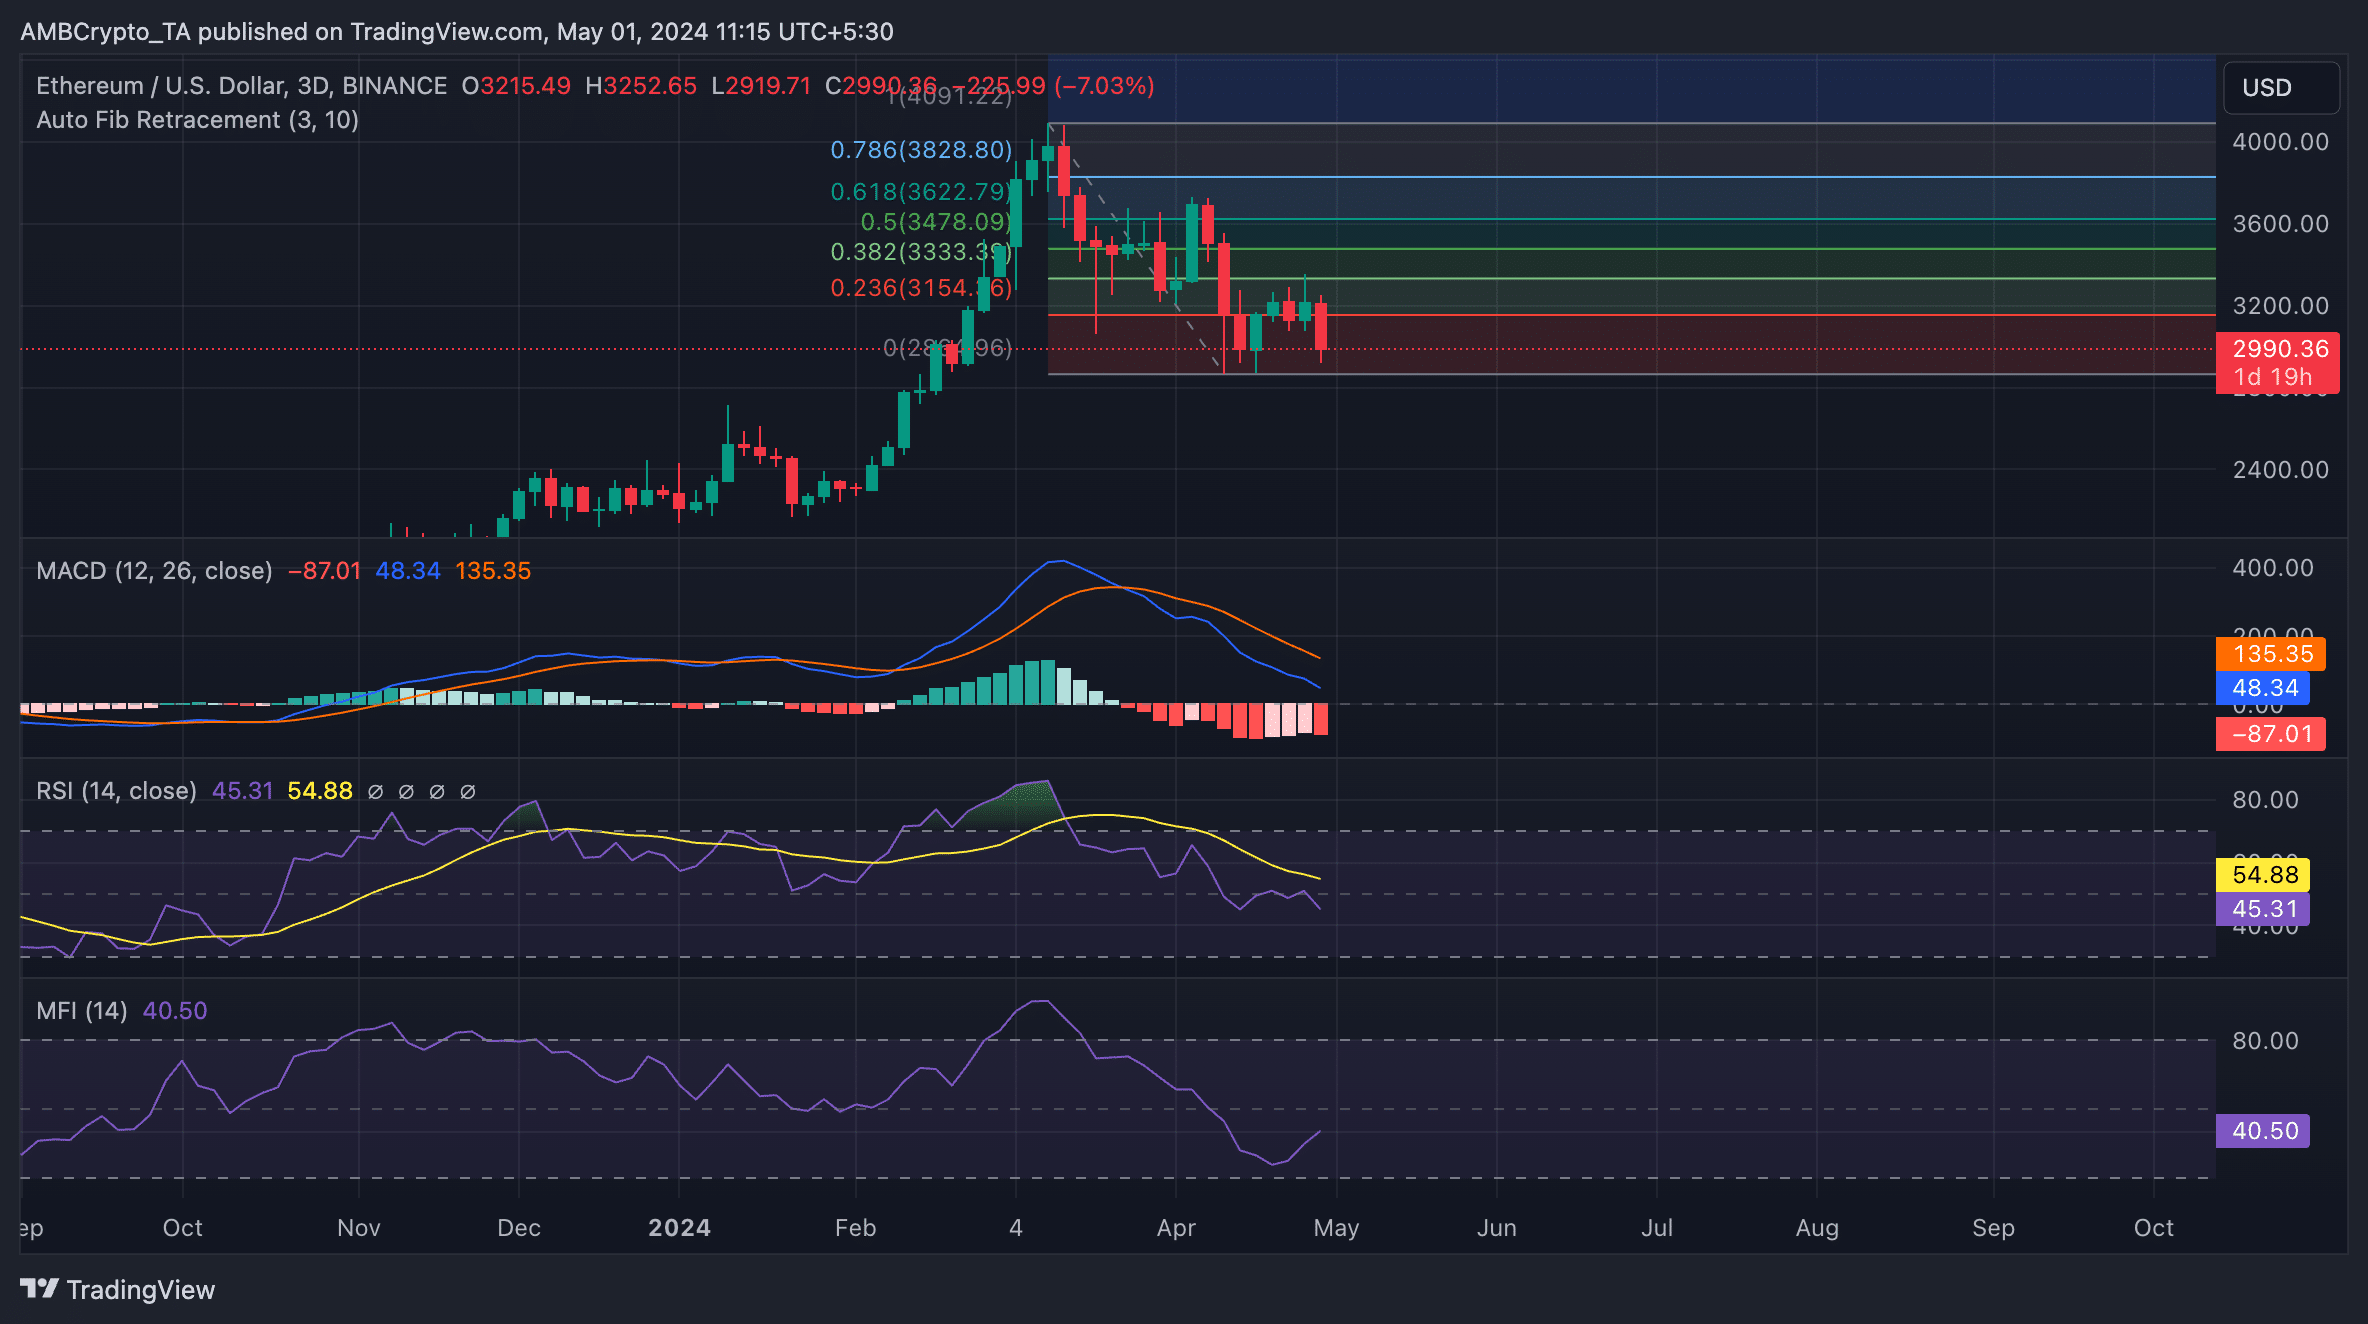
Source: ETH/USDT on TradingView
Read Ethereum’s [ETH] Price Prediction 2024-25
If bearish momentum climbs, ETH’s next price point might be $2867.
However, if the bulls increase their demand and are able to initiate a price rally, the coin might correct its movement, reclaim support at $3145, and rally toward $3300.