Ethereum, Bitcoin ETFs face sudden outflows; Is a market shift in play now?
8 August was a good day, but 9 August wasn't quite so for ETFs.

- Like BTC ETFs, Ethereum ETFs also witnessed outflows over the past few days
- Metrics and market indicators suggested that Bitcoin’s bear rally might end soon though
Despite the bearish market conditions, Bitcoin [BTC] ETFs witnessed promising inflows a few days ago. However, the trend changed over the last 24 hours.
Hence, it’s worth taking a closer look at what’s going on with ETFs, while also drawing a comparison with the state of Ethereum [ETH] ETFs.
How are Bitcoin ETFs doing?
According to recent data, Bitcoin ETFs saw inflows worth $200 million on 8 August, which appeared optimistic. Alas, this trend didn’t last as the figures turned negative just the next day.
As per SoSoValue, BTC ETFs netflows dropped under -$90 million on 9 August. Here, it was interesting to note that while Blackrock increased its holdings, Grayscale chose to sell, according to Dune’s data.

Like Bitcoin, Ethereum ETFs also witnessed a similar situation over the past few days. To be precise, ETH ETFs netflows reached $98 million on 6 August. However, the number dropped to -$15.7 million on 9 August.

A possible reason for the drop in netflows could be the bearish market conditions, as both BTC and ETH saw price declines on the charts.
In fact, according to CoinMarketCap, while BTC’s price dropped by 1.2% last week, ETH’s value plunged by more than 12% during the same period. At the time of writing, BTC was trading at $60.4k while ETH had a value of $2.6k.
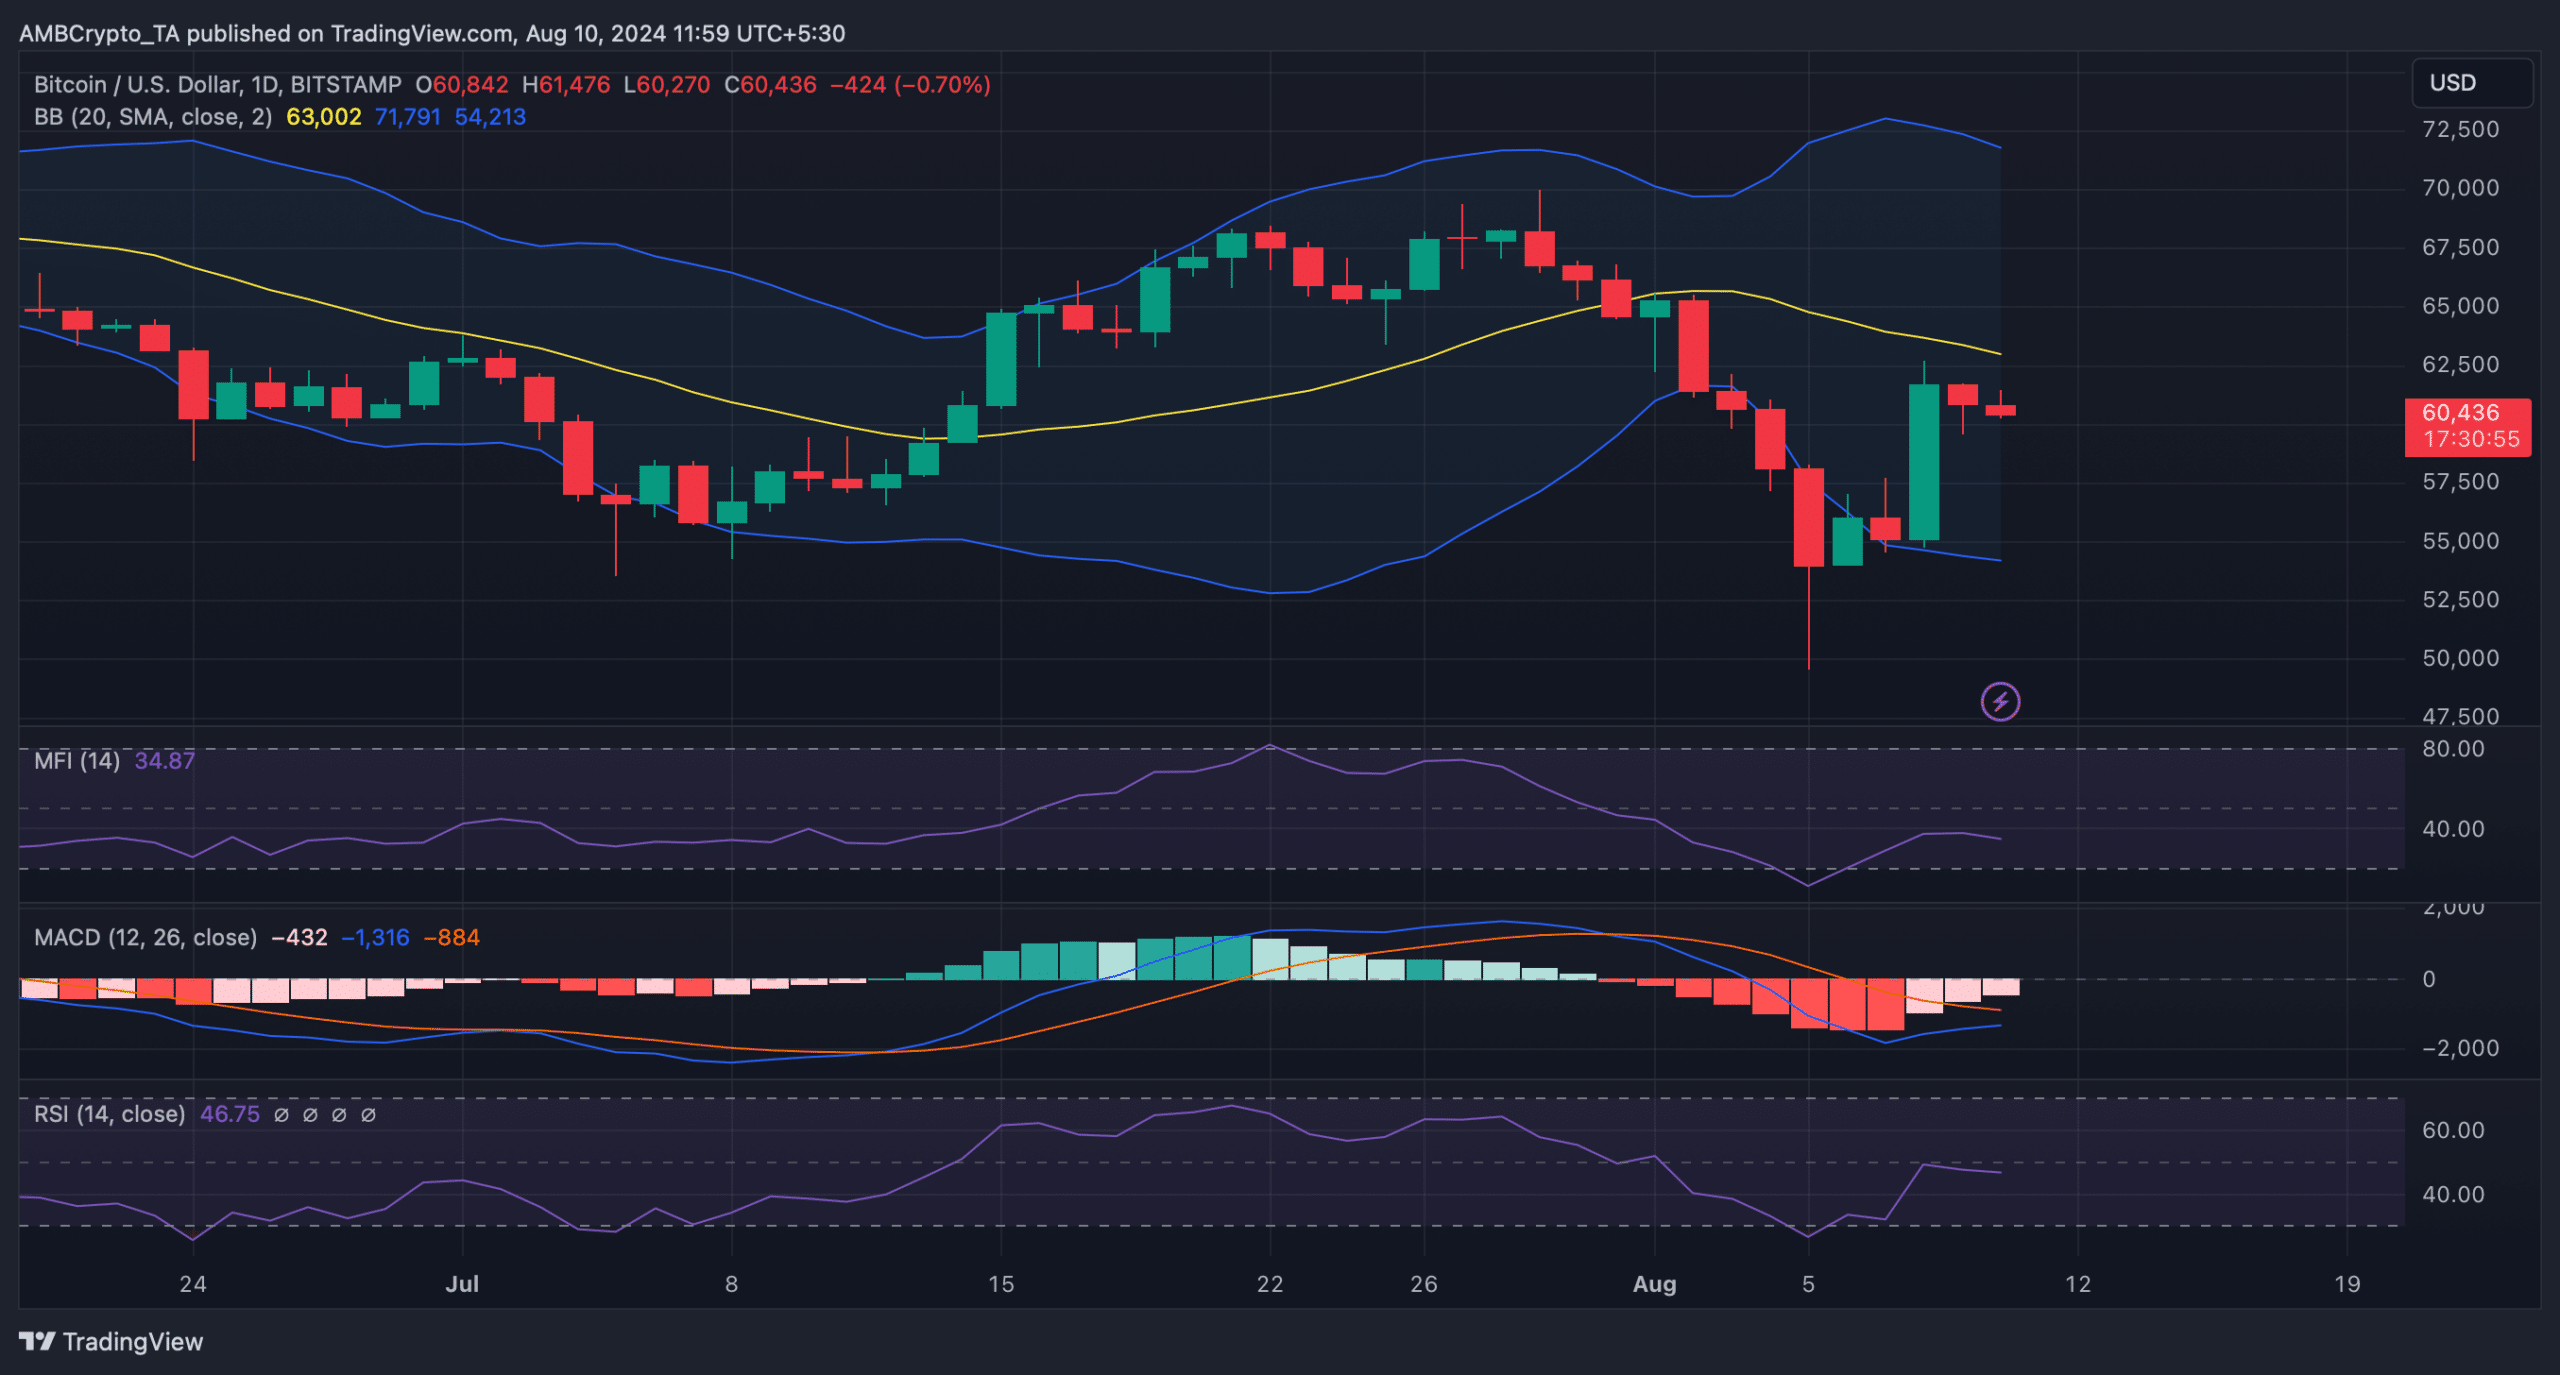
What to expect from Bitcoin?
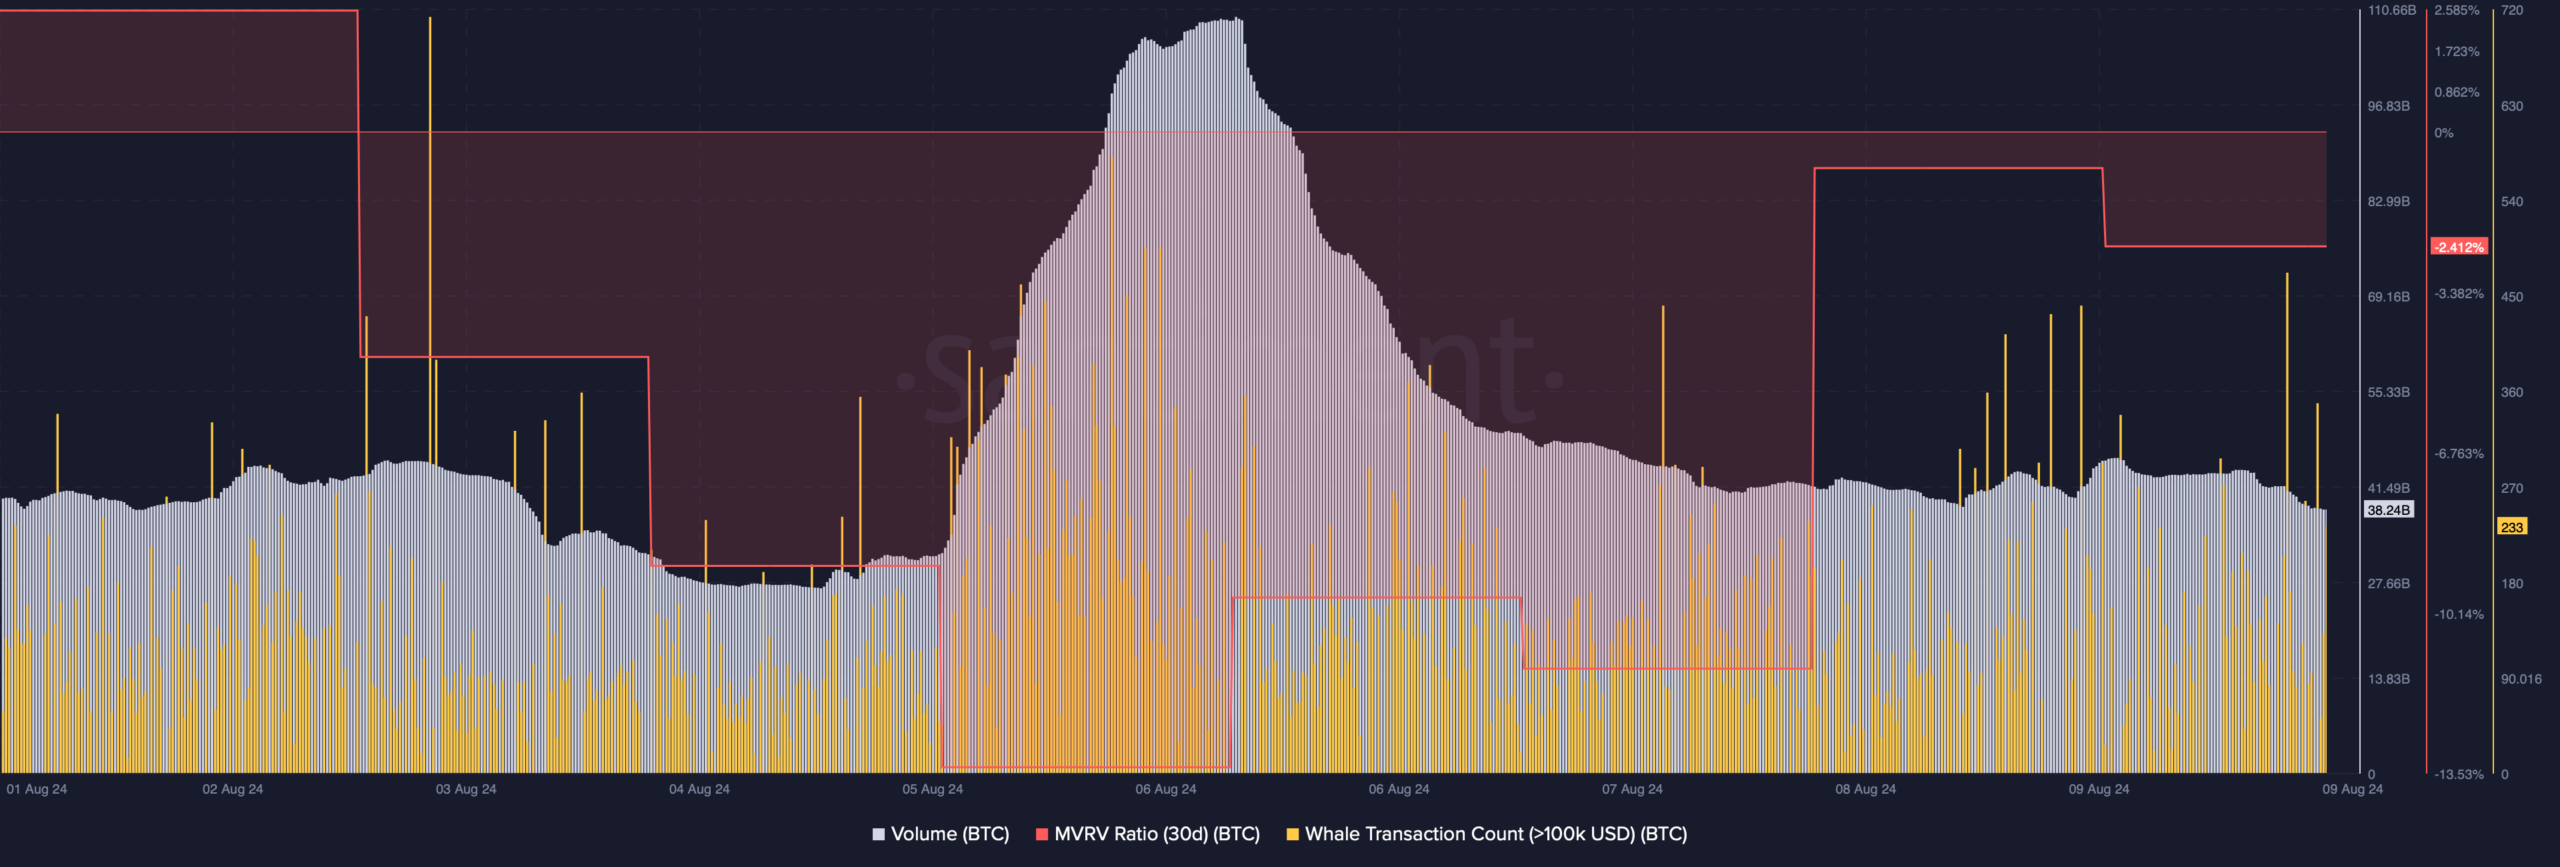
AMBCrypto then planned to have a closer look at BTC’s current state to see whether it can showcase a bullish comeback in the coming days. As per our analysis of Santiment’s data, BTC’s MVRV ratio improved – A bullish signal.
Another optimistic metric was the volume, which dropped. A decline in the metric during a bear market indicates that the bearish trend might end soon. Additionally, Bitcoin’s whale transaction count also remained high last week, meaning that whales have been actively trading BTC.
On the contrary, our look at Bitcoin’s daily chart revealed that its Relative Strength Index (RSI) registered a downtick. The Money Flow Index (MFI) went south too – A sign that BTC’s price might drop further.
Is your portfolio green? Check out the BTC Profit Calculator
Even so, the MACD displayed the possibility of a bullish crossover. Moreover, the Bollinger Bands revealed that it was about to test its resistance near the 20-day Simple Moving Average (SMA).
A successful breakout above that level would ensure the beginning of a bull rally.