

Ethereum’s Q4 test – Can treasury demand outrun macro headwinds?
Ethereum
Ethereum boasts 40% of active addresses across networks – Will price catch up?
Ethereum’s active addresses have surged past 5 million across its mainnet and Layer 2 networks, highlighting the growing dominance of the platform.


- Ethereum has surpassed 5 million active addresses across its mainnet and Layer 2 networks.
- Despite this surge in network activity, its price remains stable, trading around $2,642.
Data indicates that Ethereum [ETH] is leading the charge among Layer 1 (L1) and Layer 2 (L2) platforms regarding active addresses. Over 5 million active addresses are now recorded across the Ethereum mainnet and its L2 networks as of October 2024.
This growth in active addresses is a significant indicator of Ethereum’s increasing dominance in the blockchain space. However, the key question is: Has Ethereum’s price responded to this surge in network activity, or is there a disconnect between its usage and market performance?
Ethereum sees active address dominance
An analysis of Ethereum’s active address chart on IntoTheBlock reveals that it is outpacing other networks in growth. The data shows that Ethereum now holds a dominant position, with a notable rise in daily active addresses across both its mainnet and Layer 2 solutions like Arbitrum and Optimism.
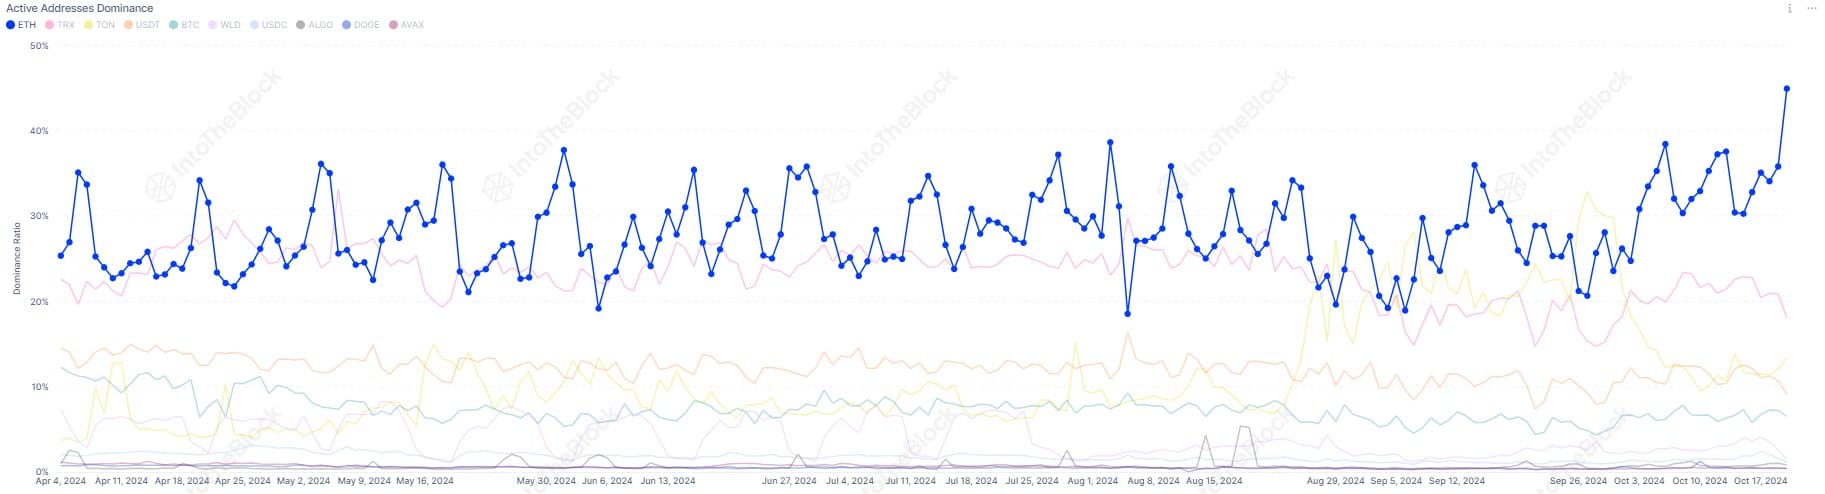
Source: IntoTheBlock
This surge in activity has pushed Ethereum’s share of active addresses to exceed 40%, driven by multiple factors. The development and increasing adoption of L2 networks have played a pivotal role in boosting Ethereum’s network usage.
Additionally, data shows a consistent climb in active addresses throughout 2024, with a significant spike in early October.
Has Ethereum’s price reacted to this network growth?
Despite the significant increase in active addresses, Ethereum’s price movement has remained relatively modest. As of October 22, 2024, Ethereum is trading at $2,642, marking a slight decline of 0.85% in the last 24 hours.
The price has been fluctuating within the $2,600 to $2,670 range, finding support near its 50-day moving average of $2,485.
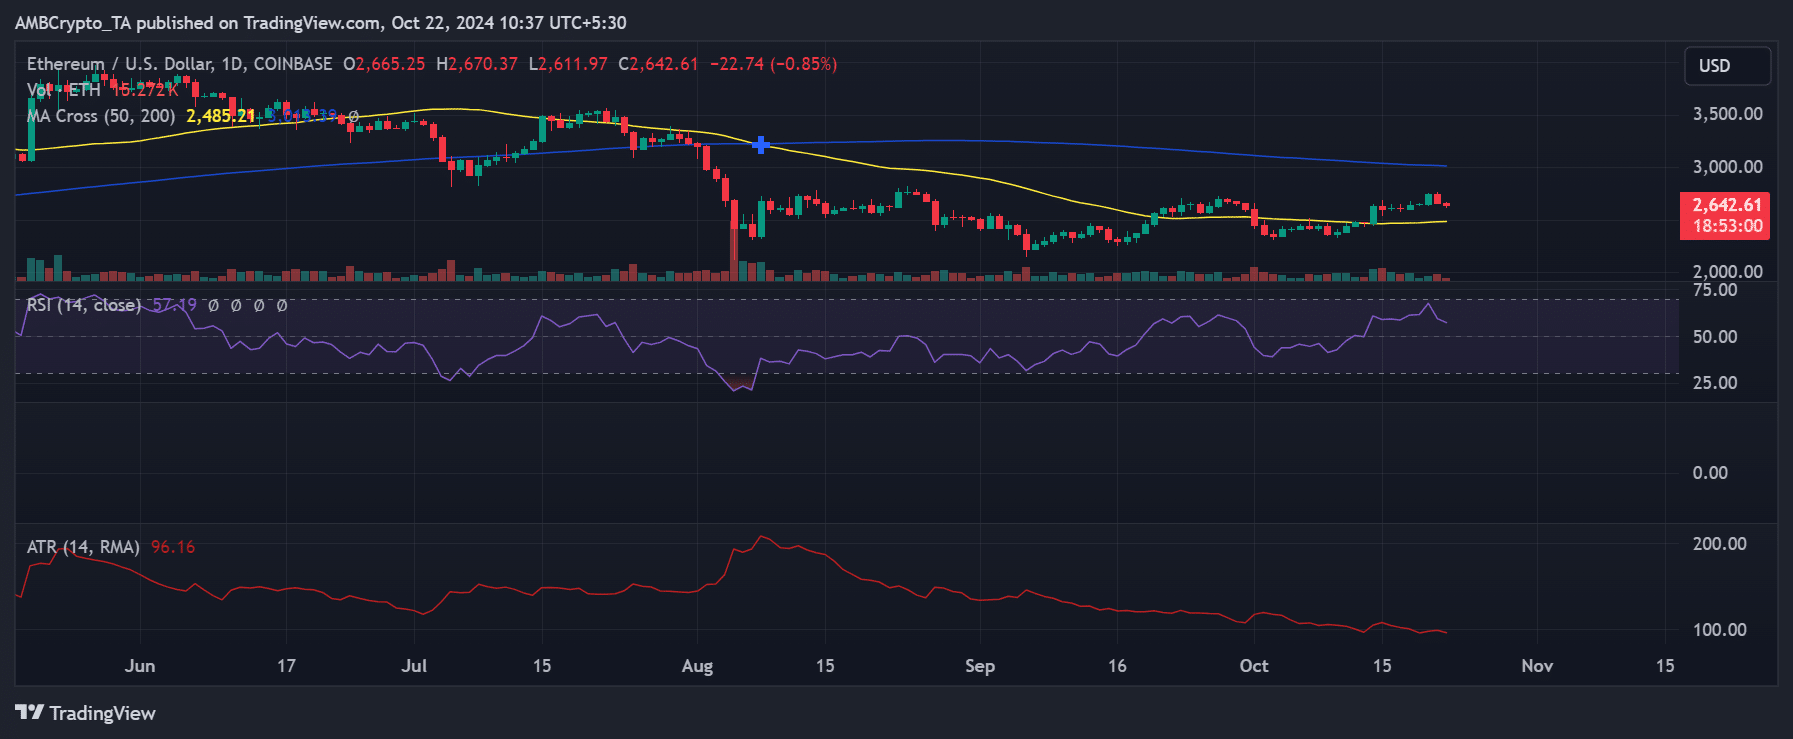
Source; TradingView
While the rise in active addresses demonstrates ETH’s growing utility, the price has yet to reflect this increase in network activity fully. The Relative Strength Index (RSI) currently sits at 57.19, indicating neutral market momentum without being overbought or oversold.
Additionally, the Average True Range (ATR) of 96.16 shows a small uptick in volatility but not enough to suggest a major price movement.
These indicators suggest that, although ETH’s usage is on the rise, external market factors and broader investor sentiment are playing a larger role in determining price action.
ETH price still playing catch-up
The increase in active addresses underscores Ethereum’s expanding ecosystem and growing demand.
If Ethereum can maintain this momentum, with continued adoption of Layer 2 networks and strong staking participation (over 34 million ETH currently staked), there is potential for the price to catch up to its on-chain growth.
Read Ethereum (ETH) Price Prediction 2024-25
However, despite these positive signals, ETH’s price remains cautious. Technical indicators point to mixed signals, suggesting that while ETH’s network is flourishing, the market may be waiting for stronger catalysts to drive the price higher.


