Ethereum bounces from $1600: What’s ahead?
Here's ETH's recovery pain point after a strong rebound from $1600 support level.

Disclaimer: The information presented does not constitute financial, investment, trading, or other types of advice and is solely the writer’s opinion.
- ETH saw a corrective bounce from key ascending support near $1600.
- Open interest rates declined; the CVD spot eased, suggesting muted demand.
Ethereum [ETH] rebounded strongly from critical ascending support near $1600. But a recent report portrays grim prospects for the ecosystem as fees, NFT volume, TVL (total value locked), and overall network growth declined.
Read Ethereum’s [ETH] Price Prediction 2023-24
The $1800 and $1700 price zones have been key support levels in Q2 2023. However, both supports have been breached as Bitcoin [BTC] saw massive losses, and macro headwinds persisted in Q2.
Can bulls flip $1700 to support?
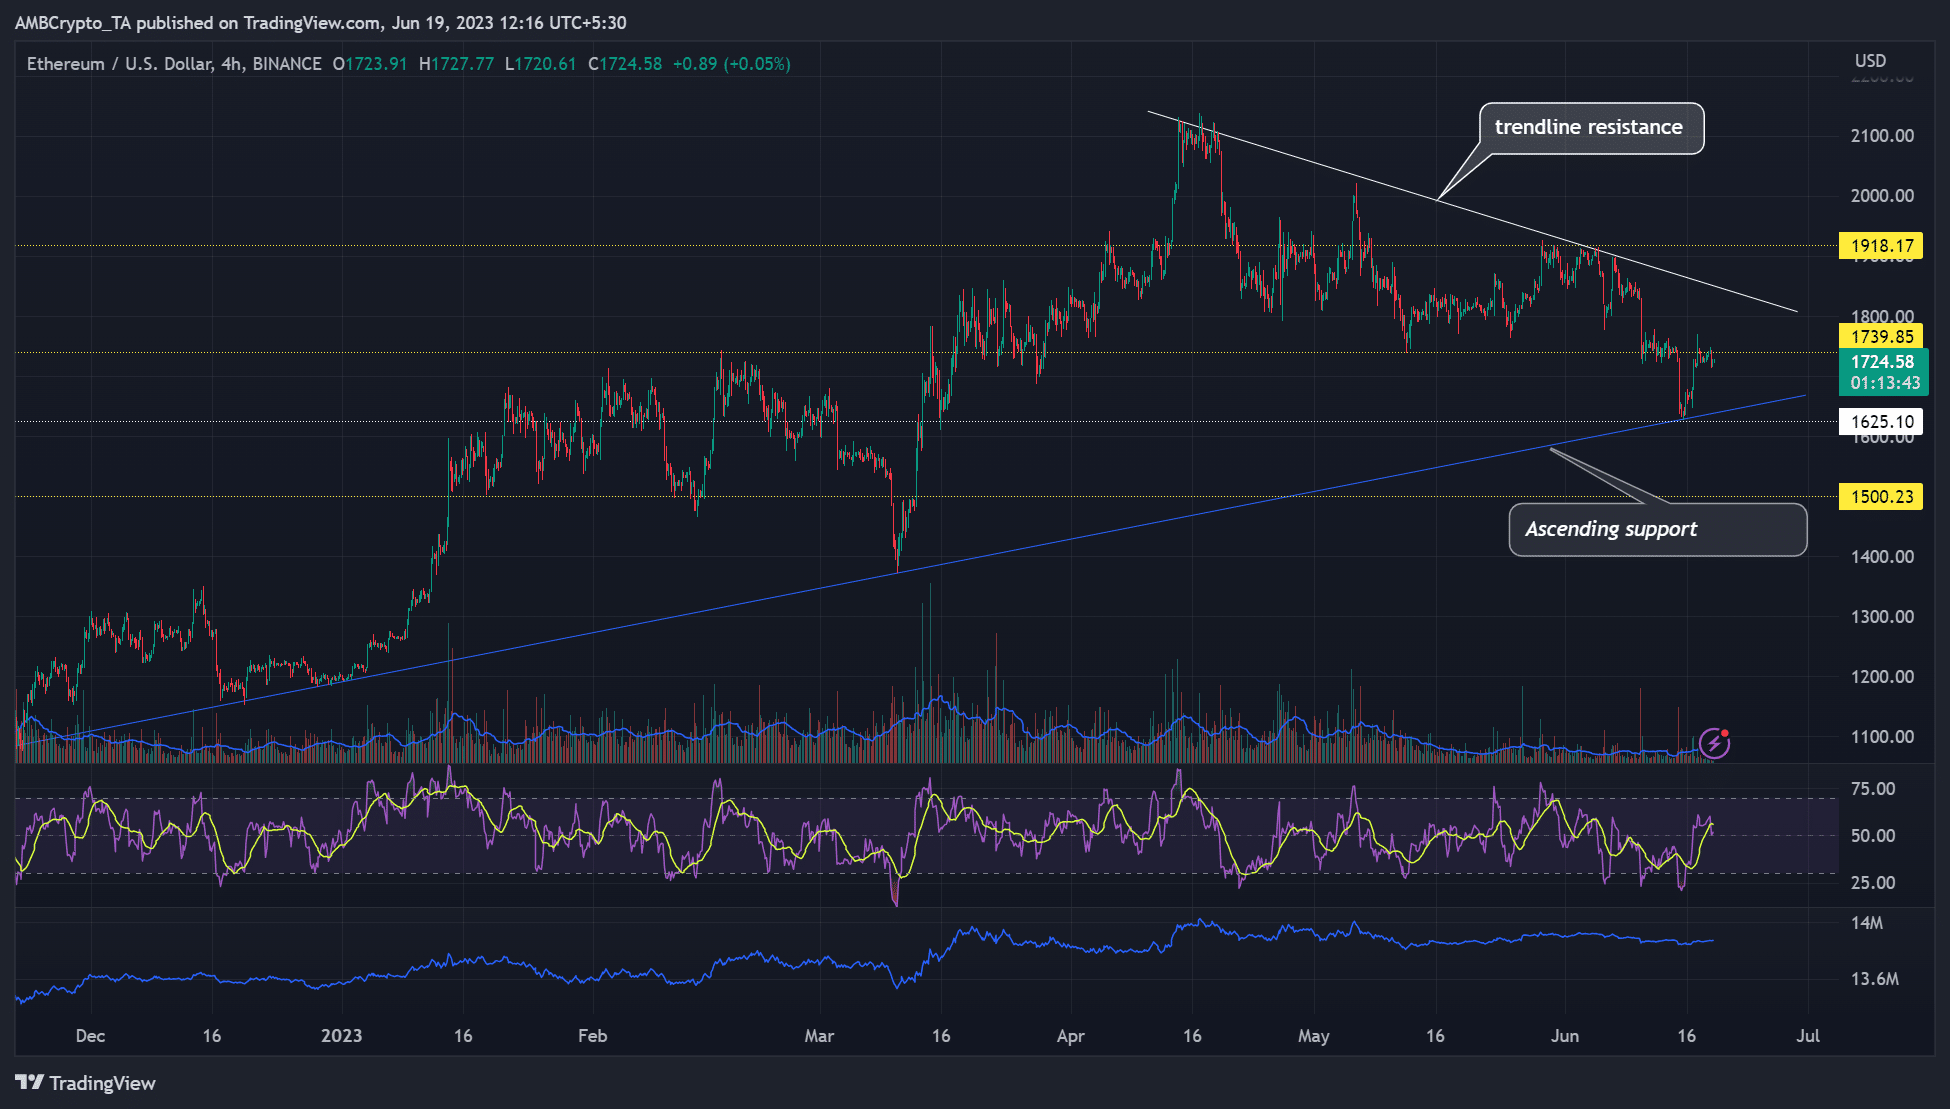
The ascending support (blue line) has been at a crucial demand level since early 2023. The subsequent ETH’s lower lows from mid-April prompted a retest of the ascending support on 15 June.
But ETH rebounded strongly from the ascending support, posting about 7% gains, rising from $1627 to $1769. The mild rally fluctuated narrowly below the $1740 resistance at press time.
The RSI (Relative Strength Index) rested on the neutral level after a recent surge, suggesting less buying pressure at the time of writing. But the OBV (On Balance Volume) was significantly below the highs recorded in the second half of May – muted demand.
Besides, the H4 market structure was bearish at press time and could only flip bullish if ETH moved beyond $1775. So, a downswing couldn’t be overruled, and a retest of the ascending support near $1640 was on the cards.
Conversely, a surge above the resistance level and a close above $1775 could make a foray into $1800 and a retest of the trendline resistance feasible.
Open interest rates declined; CVD spot eased

Throughout June, ETH’s open interest (OI) rates, which track the number of futures’ open contracts, have declined from >$6.2 billion on 3 June to <$5.5 billion by the time of writing.
That’s more than a $0.5 billion drop in OI, which painted a prevailing bearish sentiment in the futures market.
Is your portfolio green? Check out the ETH Profit Calculator
On Coinalyze’s 1-hour chart, the CVD (Cumulative Volume Delta) spot, which tracks buying/selling volume, rose sharply from 15 June but moved sideways at the time of writing.
It shows declining buying volumes and cautions ETH near-term bulls, as prices could go in either direction.