Ethereum bulls have a tough battle ahead: Will these key levels help?
The weakness among on-chain metrics signals bearish dominance, and bulls might have to endure more losses.

- Data of holders in/out of the money provided valuable insights into where Ethereum could halt its downtrend.
- Two network metrics showed increased selling pressure behind ETH in recent weeks that has not yet let up.
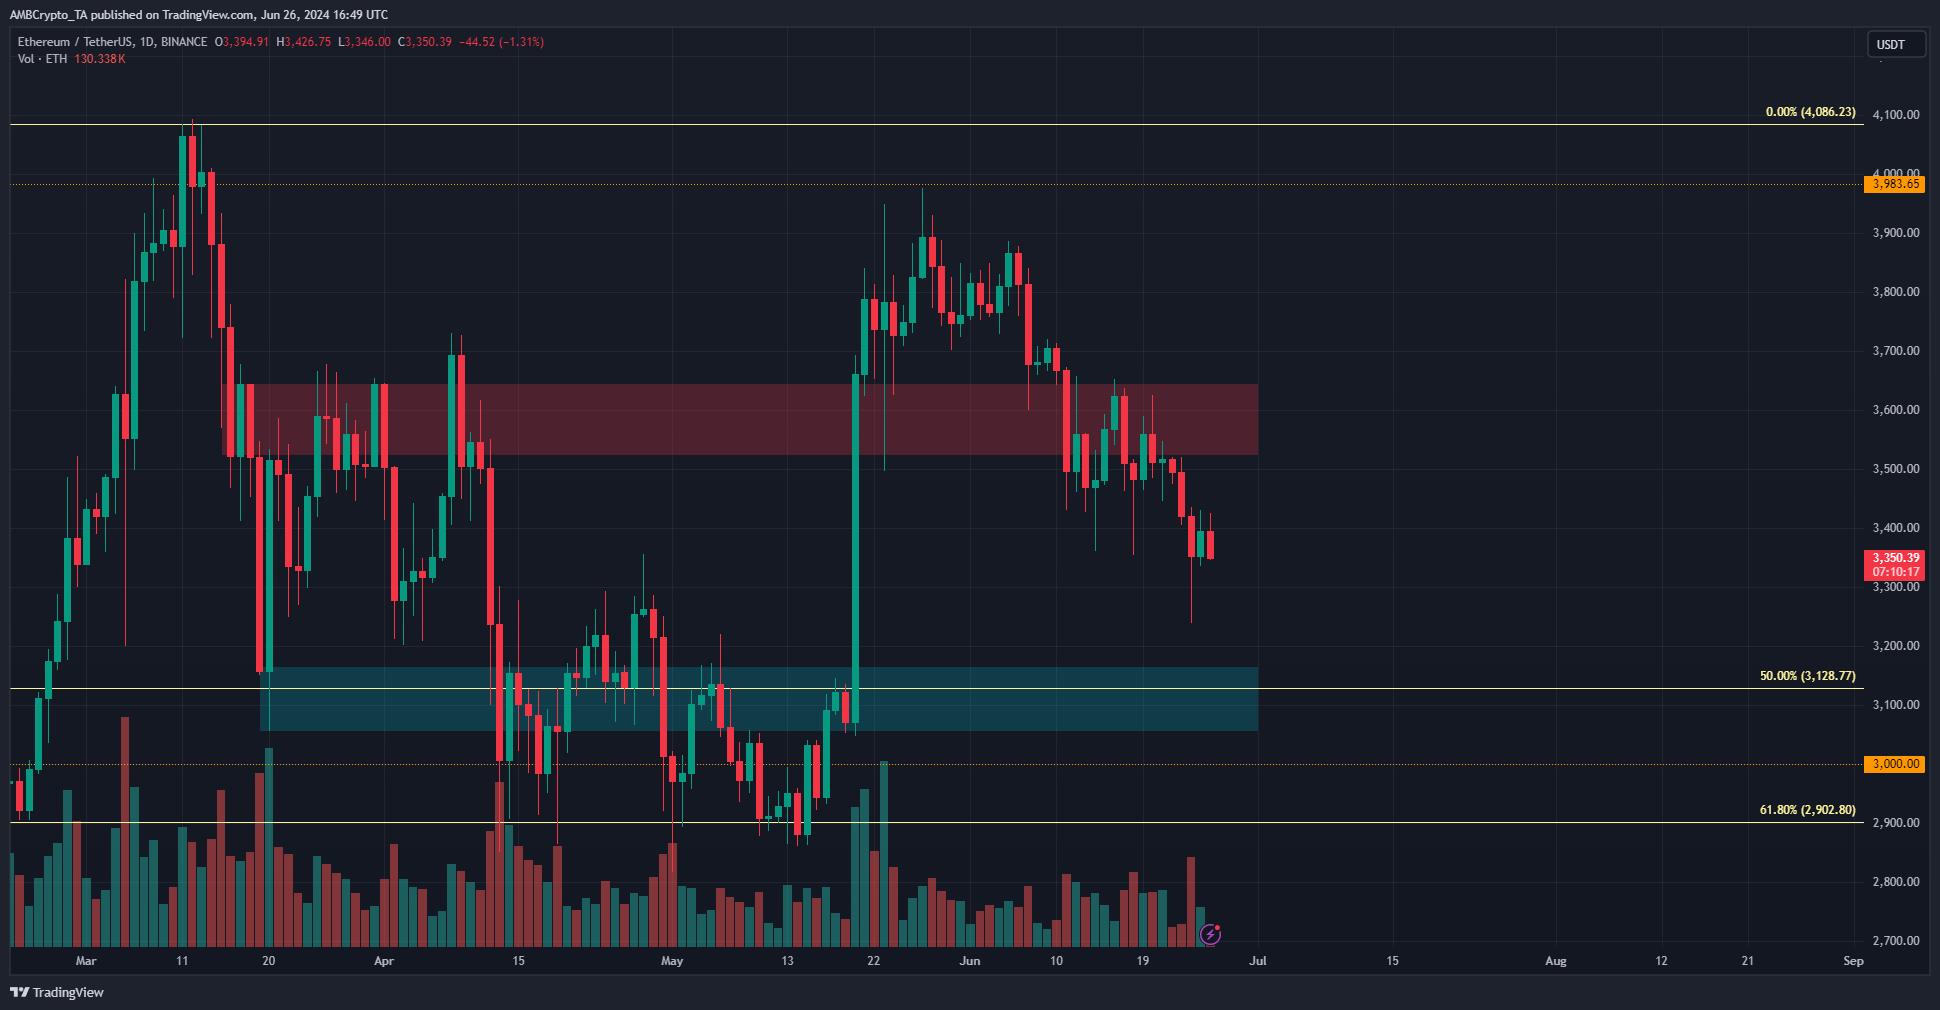
Ethereum [ETH] bulls were in a pickle after failing to defend the $3.6k demand zone earlier this month.
The $3600-$3650 region had served as resistance back in March and the first half of April but was breached and flipped to support in late May.
The Ethereum ETF hype was building for July, but with Bitcoin [BTC] set to face selling pressure from miners and Mt. Gox and a general lack of demand, ETH bulls might have an uphill battle ahead.
A price drop toward the next support zone is anticipated- but where will the correction likely halt?
Major support and resistance zones
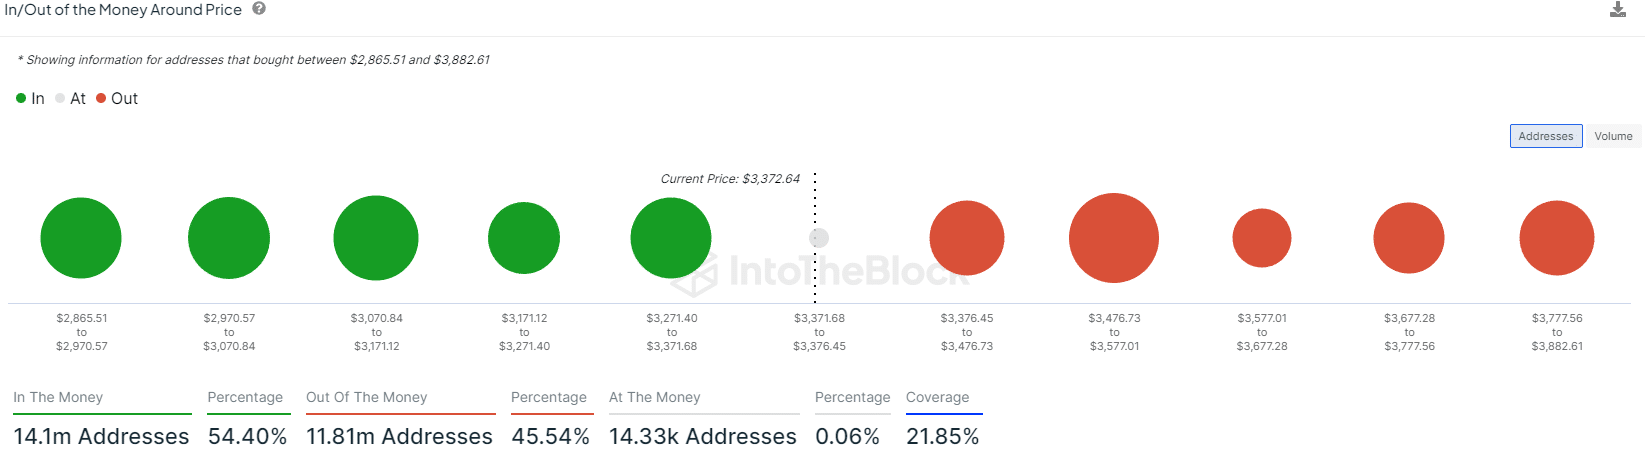
AMBCrypto observed that the in/out of money around the price data from IntoTheBlock showed a large amount of ETH was bought in the $2970-$3171 zone, amounting to 2.28 million Ethereum.
As the price approaches this level, the amount of holders at the money would increase, which means this region would be hard to break down.
Similarly, any price bounce would struggle to climb above $3.5k, since many of the holders would be near breakeven at that price and would look to sell due to the fearful conditions.
Therefore, in the coming weeks, the $3.1k and $3.5k levels are the ones to watch out for.
Active address count reflects positively on network health
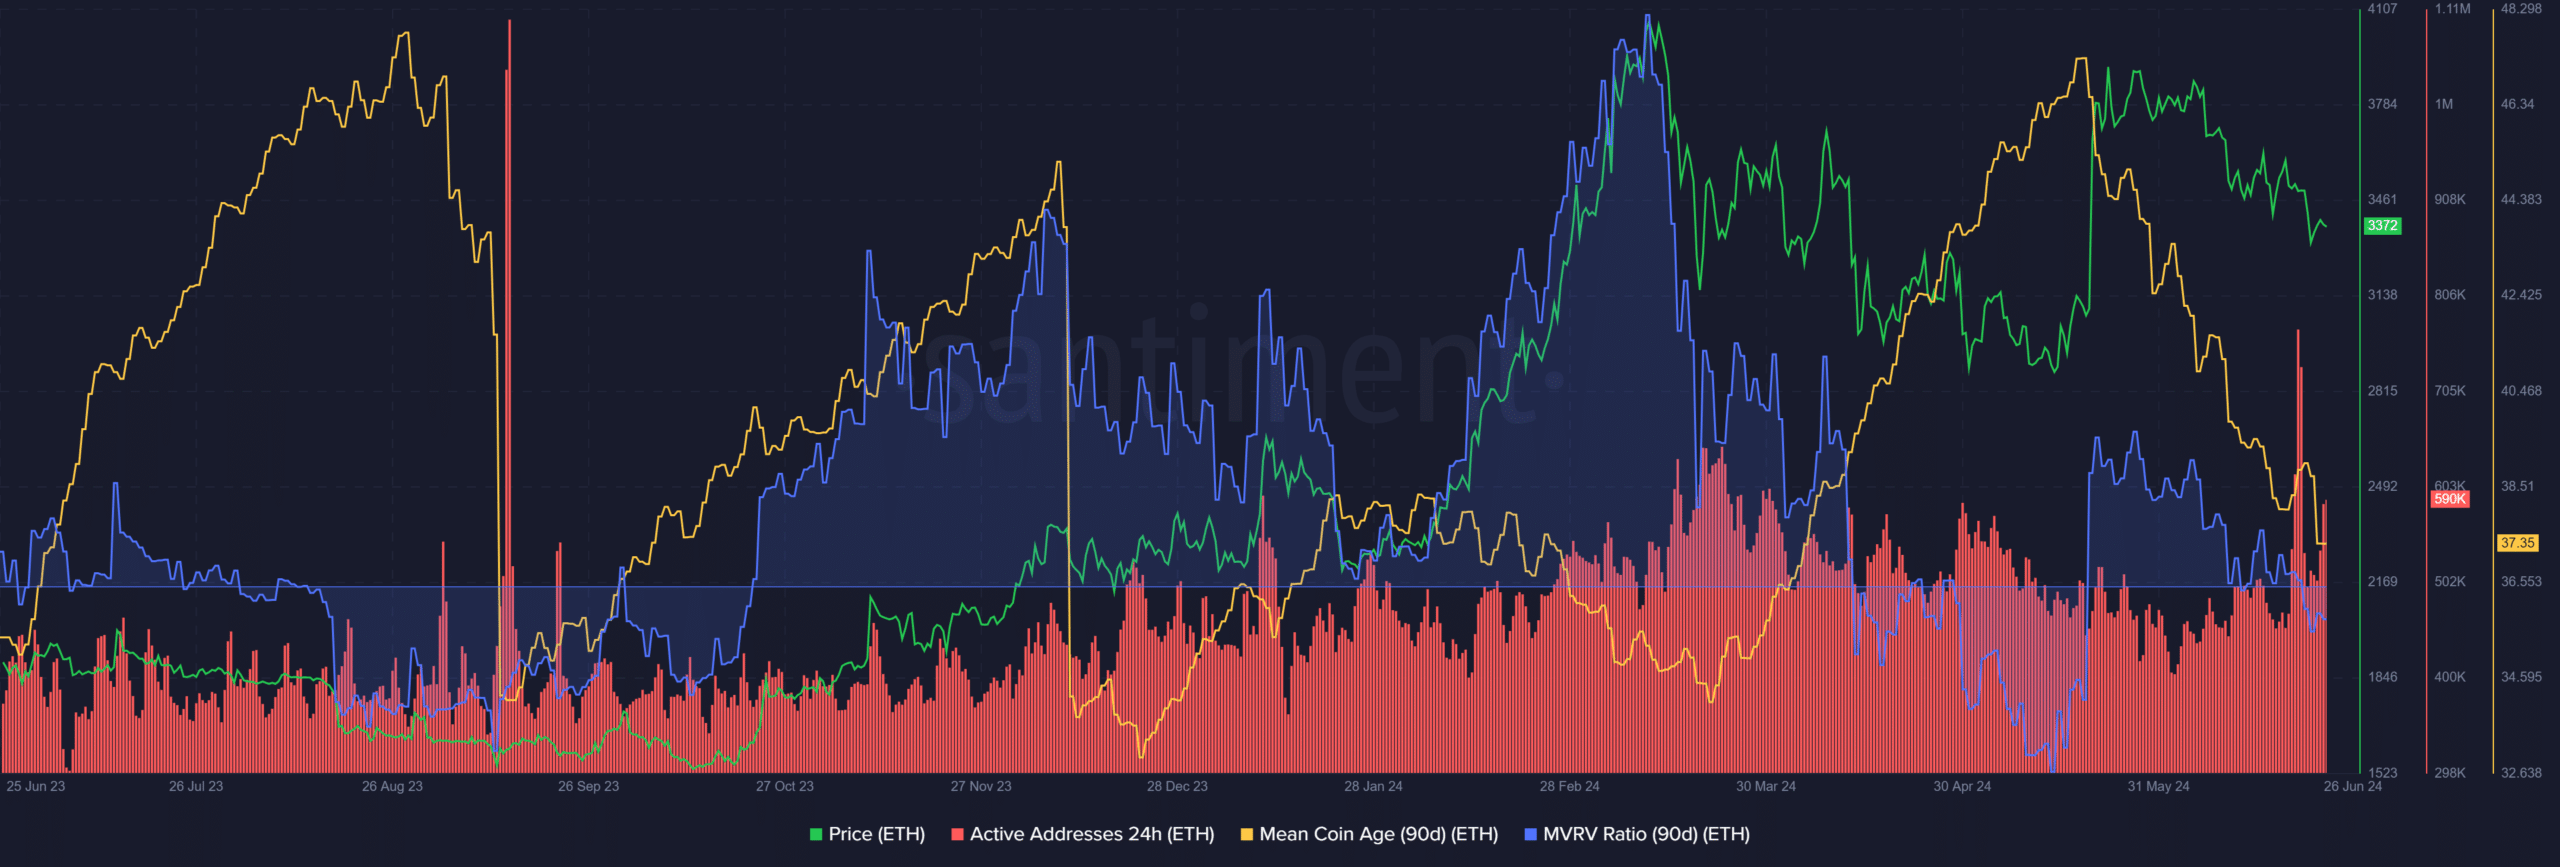
The daily active addresses have trended upward in June even though prices have fallen lower. Rising active addresses is a good sign for network usage. But the other metrics were bearishly biased.
Is your portfolio green? Check out the ETH Profit Calculator
The mean coin age has dramatically trended downward over the past month. This showed token movement across the network and distribution. The MVRV ratio also fell below zero to highlight holders at a loss.
Together, they were a strong sign of further bearishness. The MCA has to begin trending higher to hint at price recovery.