Ethereum bulls rejected from $1915 again as…
On-chain metrics showed investors accumulated Ethereum since March, but the price action indicated that the market was yet to accept prices above the $1900 mark.

Disclaimer: The information presented does not constitute financial, investment, trading, or other types of advice and is solely the writer’s opinion.
The week started positively for Ethereum [ETH]. The U.S. debt ceiling talks got “an agreement in principle” on Saturday during a phone call between President Joe Biden and House Speaker Kevin McCarthy.
Bitcoin and Ethereum reacted positively to this over the weekend. On Friday, there was news that a deal was closer to being finalized and Dow Jones registered gains.
In the past two days, Ethereum saw another move higher. A look at the lower timeframe charts showed strong bullish momentum and a breakout past the $1880 resistance. Can the bulls defend this zone as support now, and will Ethereum resume its upward march once more?
Two critical support zones for buyers to defend in the coming weeks
A recent report highlighted that the amount of ETH staked on the Beacon chain grew by 11% from the Shapella upgrade to 21.6 million. Stakers showed faith, although 60% of them were at a loss after Ethereum’s fall beneath $2000 in mid-April.
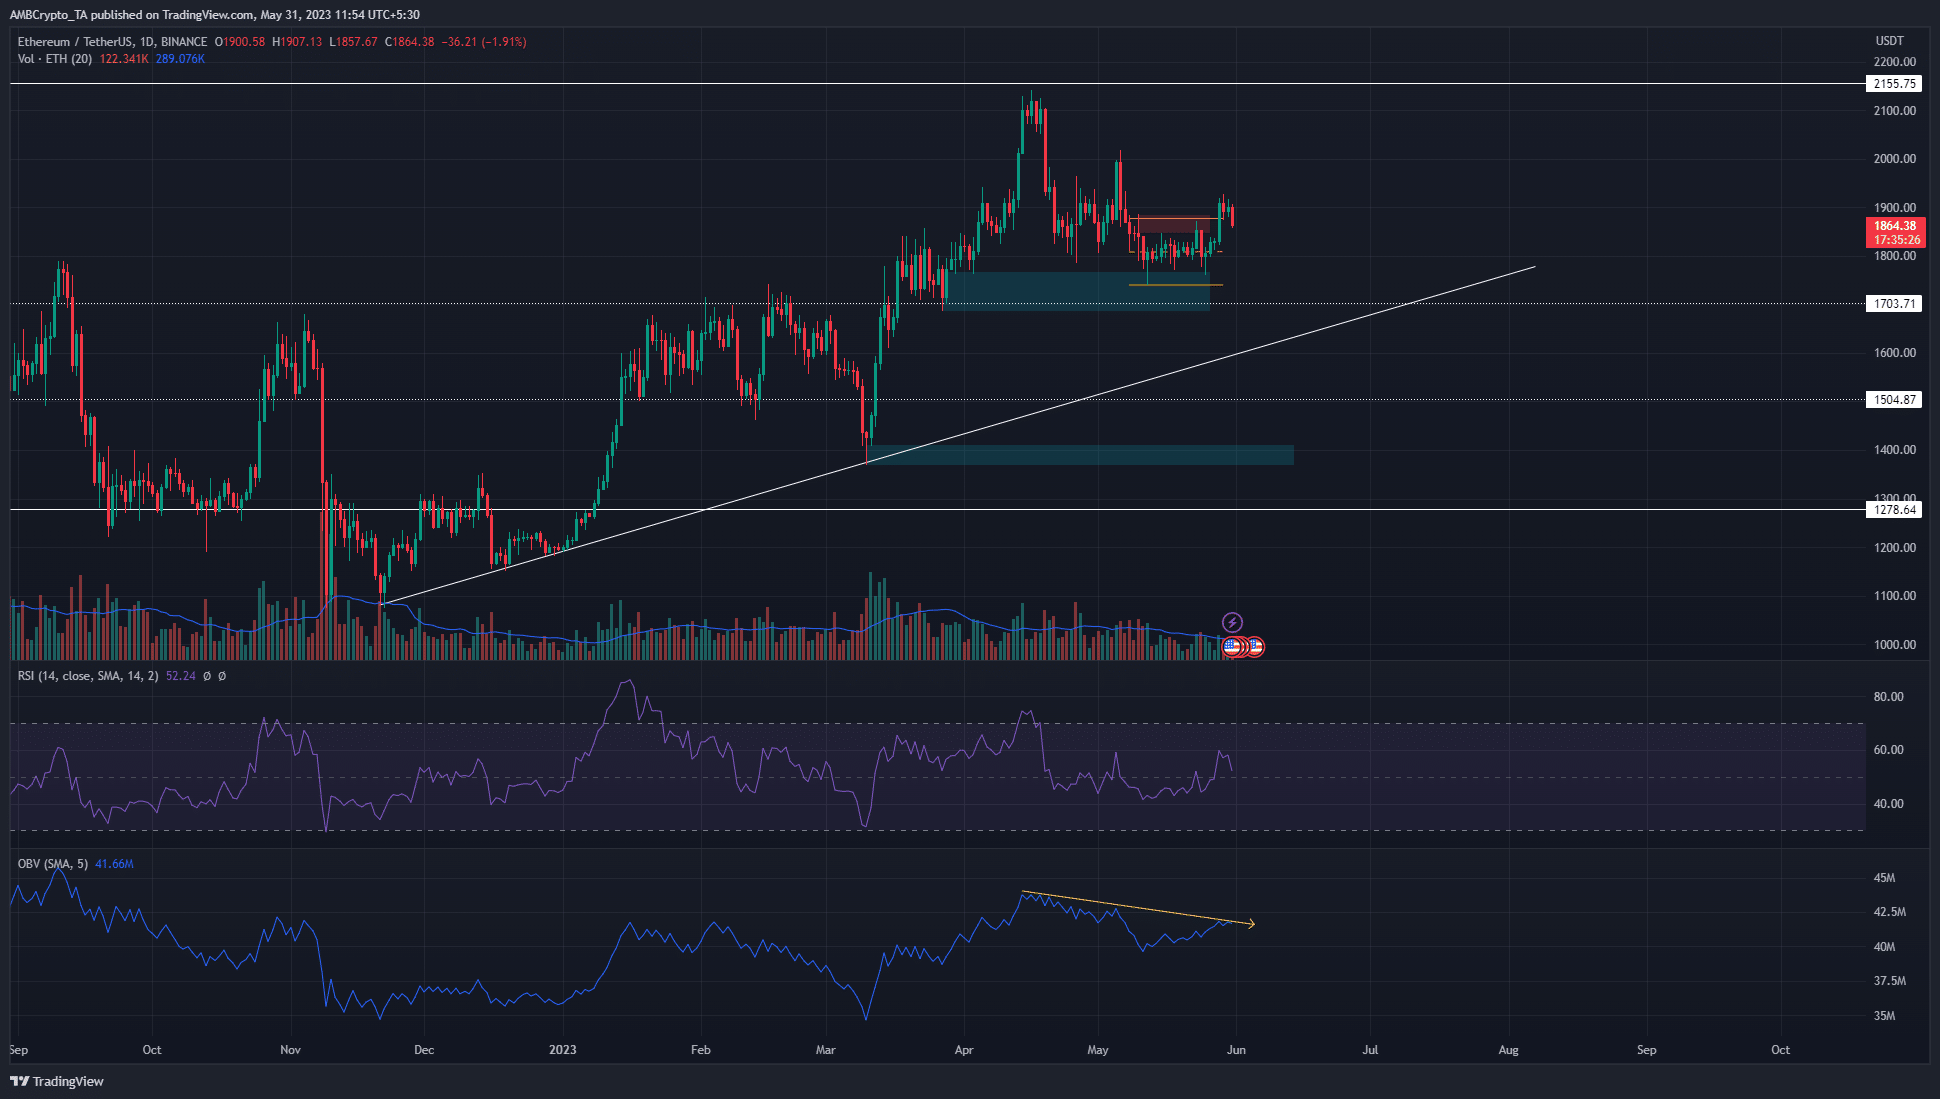
The ascending trendline showed that despite the turmoil in the past six weeks on the price chart, the trajectory of the market on the higher timeframe was upward. Yet, further study of the price action showed that ETH exhibited a bearish structure until Sunday.
The structure was flipped to bullish upon the surge past $1872, and the price was retesting the same area as support at the time of writing.
Meanwhile, the OBV was also in decline from the highs at $2155 on 16 April. This showed dominant selling pressure. The RSI was at 52, after moving above the neutral 50 mark during the recent surge.
The $1850-$1880 represented a bullish breaker block on the 4-hour charts and the short-term range highs. A retest of this area should yield a bounce in prices in an ideal scenario for the bulls.
A move below $1840 would indicate a rejection from the $1900 resistance zone.
On-chain metrics hinted at an accumulation phase for ETH
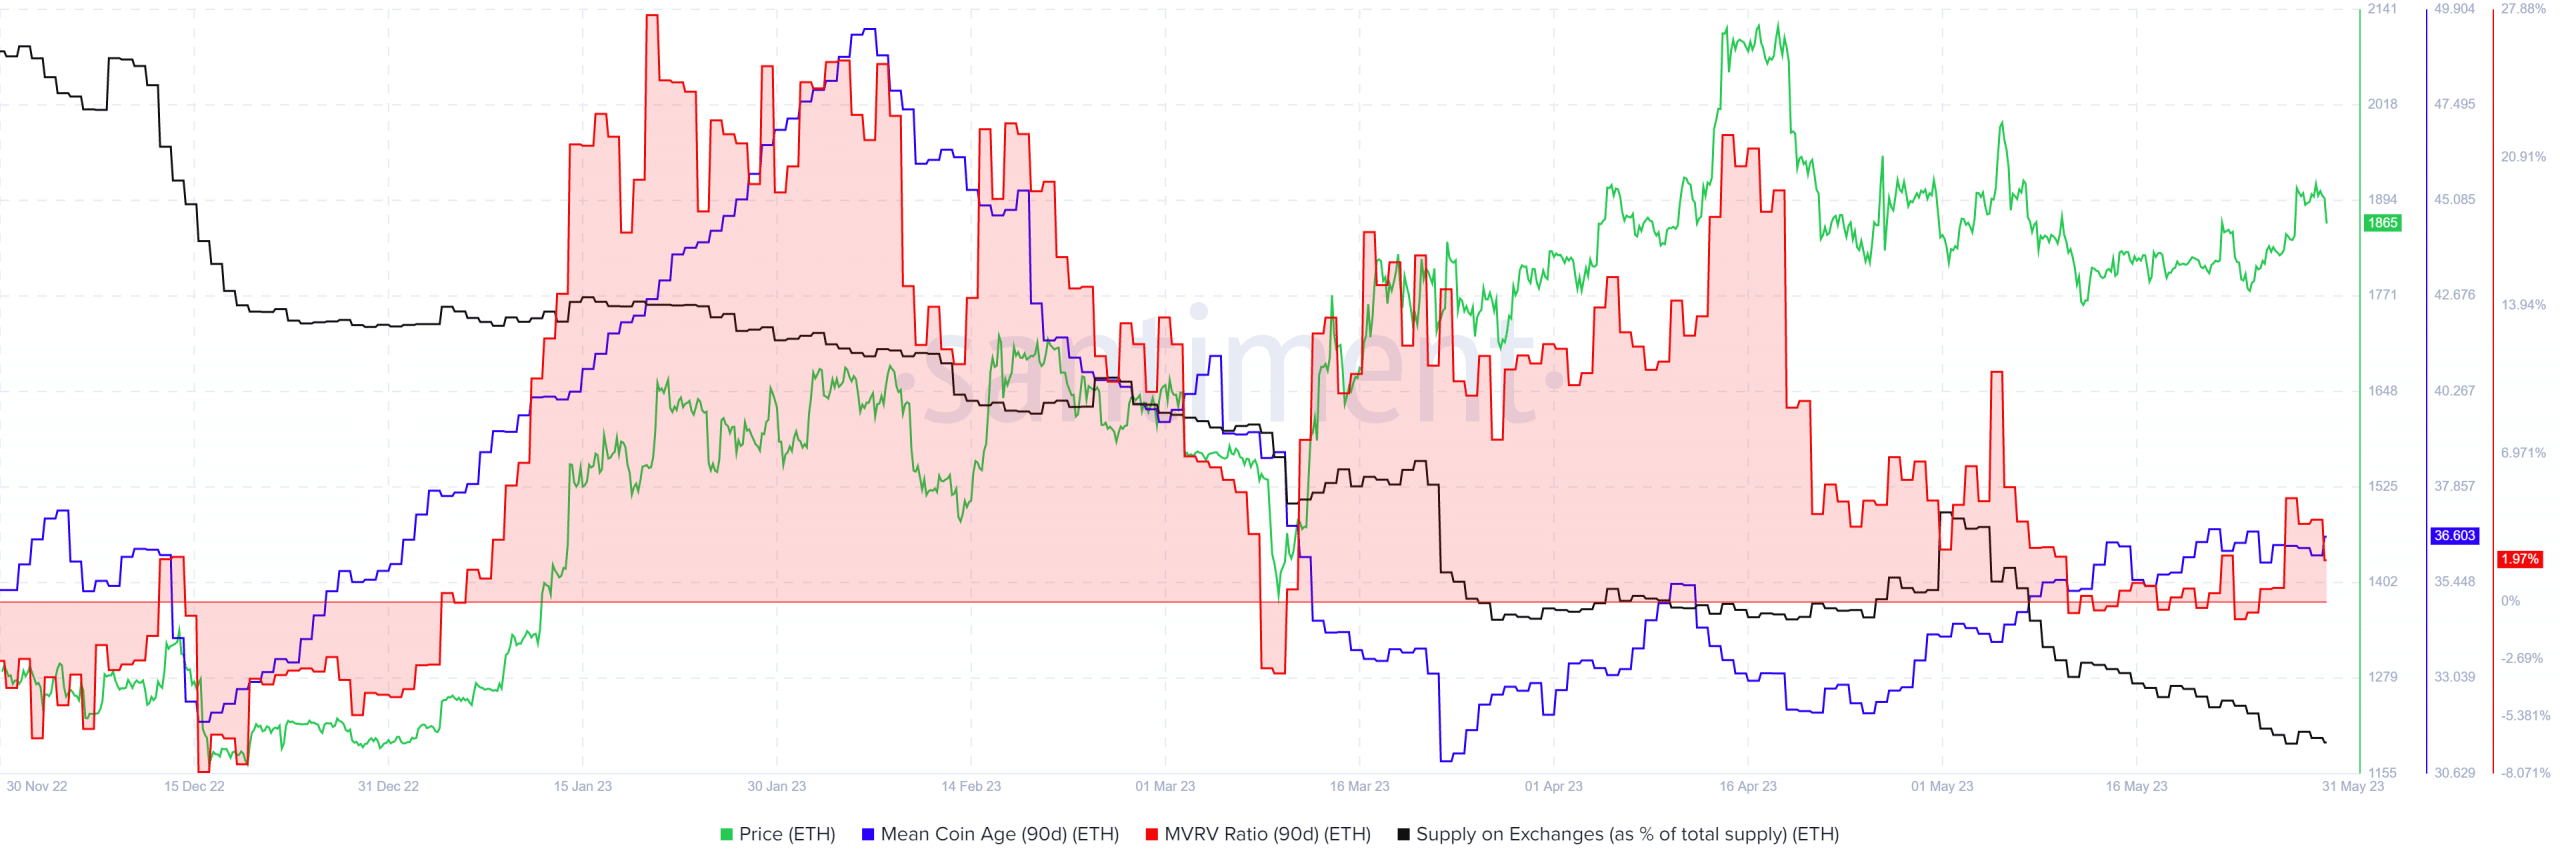
While the price slowly pushed higher since March, the mean-coin age also initiated an uptrend. In early April this metric began to climb higher slowly but steadily. It suggested decreased ETH movement between addresses, which in turn showed reduced selling pressure.
Read Ethereum’s [ETH] Price Prediction 2023-24
Alongside this, the supply on exchanges was also falling, according to Santiment data. Taken together, it showed investors accumulating ETH.
The 90-day MVRVC ratio was just above the zero value and did not indicate heavy profit-taking was an imminent possibility.


