
- A bullish double-bottom price action pattern has been spotted on Ethereum in the 4-hour time frame.
- Short sellers are not expecting ETH to reach the $3,250 level, if it does reach this level, $1.65 billion worth of short positions will liquidate.
The world’s second-biggest cryptocurrency Ethereum [ETH] has experienced a price surge of over 5.5% following the recent update on spot Ethereum ETF (Exchange Traded Fund) in the United States.
After this ETF update, the overall crypto market turned green and investor sentiment shifted positively.
With this impressive price momentum in the last 24 hours, ETH has just reached near the 200 Exponential Moving Average (EMA). Additionally, it is just one candle away from bullishness as it is lagging slightly behind 200 EMA.
Ethereum bullish double bottom breakout
According to expert technical analysis, ETH was looking bullish as it formed a double-bottom price action pattern in a 4-hour time frame and at a neckline near the $3,085 level.
If it gives a breakout and 4-hour candle closing above the neckline, there is a high possibility for ETH to hit the $3,250 and $3,300 levels.
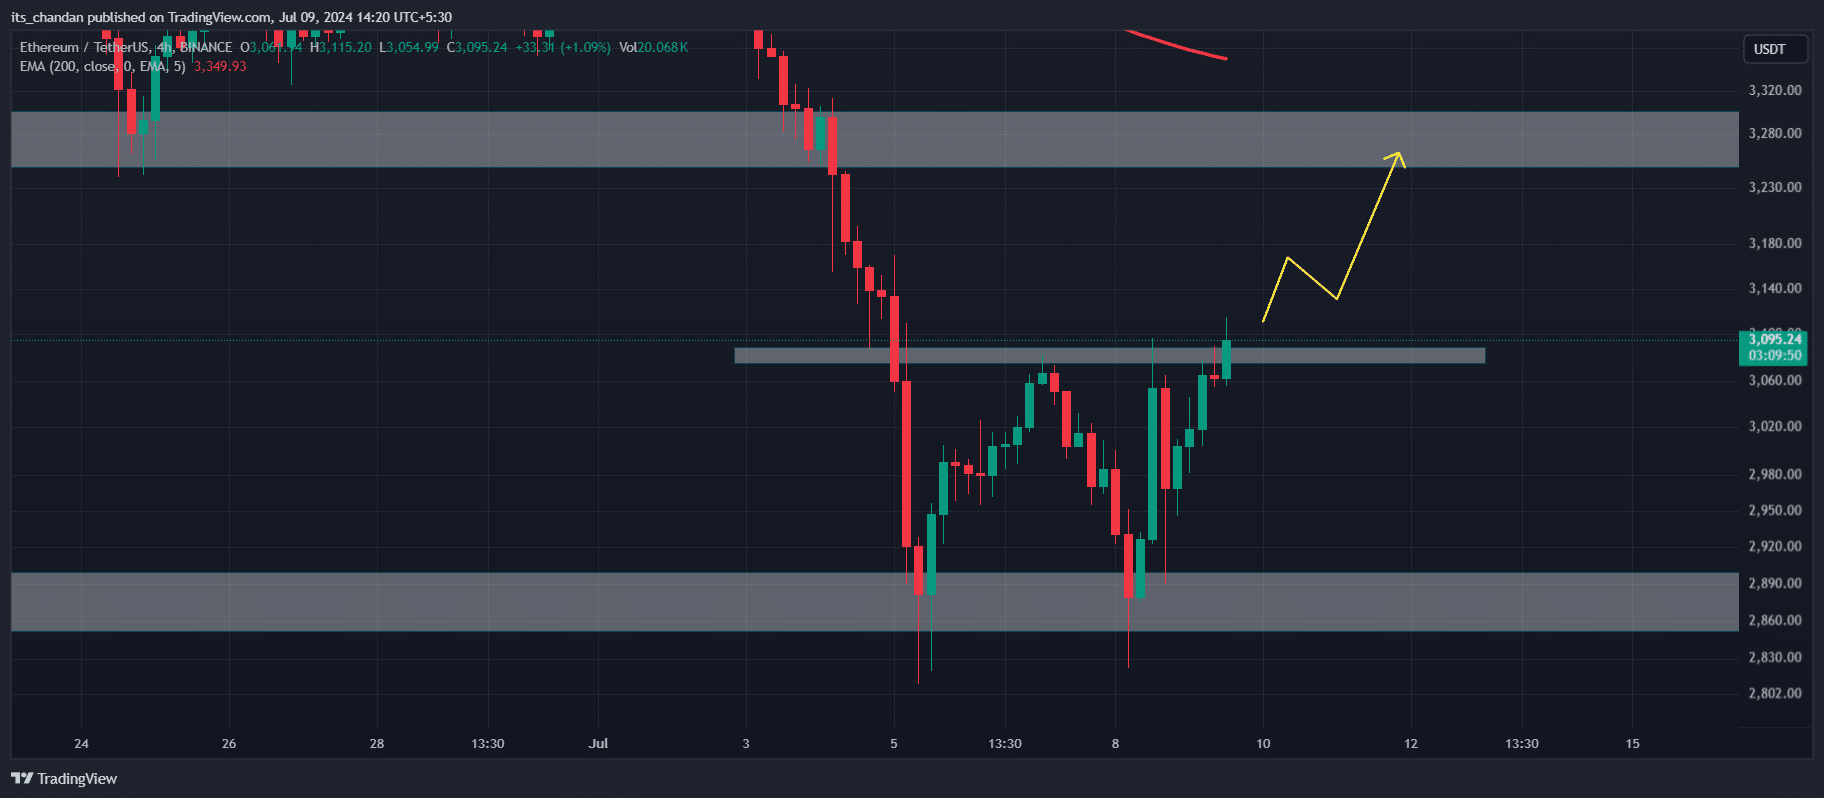
Source: TradingView
Furthermore, this bullishness in the Ether chart is also getting support from the Relative Strength Index (RSI), which is in the oversold area and signals a potential recovery.
Despite this bullish double-bottom pattern, ETH has been consolidating within a tight range between the $2,850 and $3,080 levels for the last five days.
However, this consolidation is taking place at an important support level, and a breakout or breakdown from this consolidation zone may cause a significant price momentum in either direction.
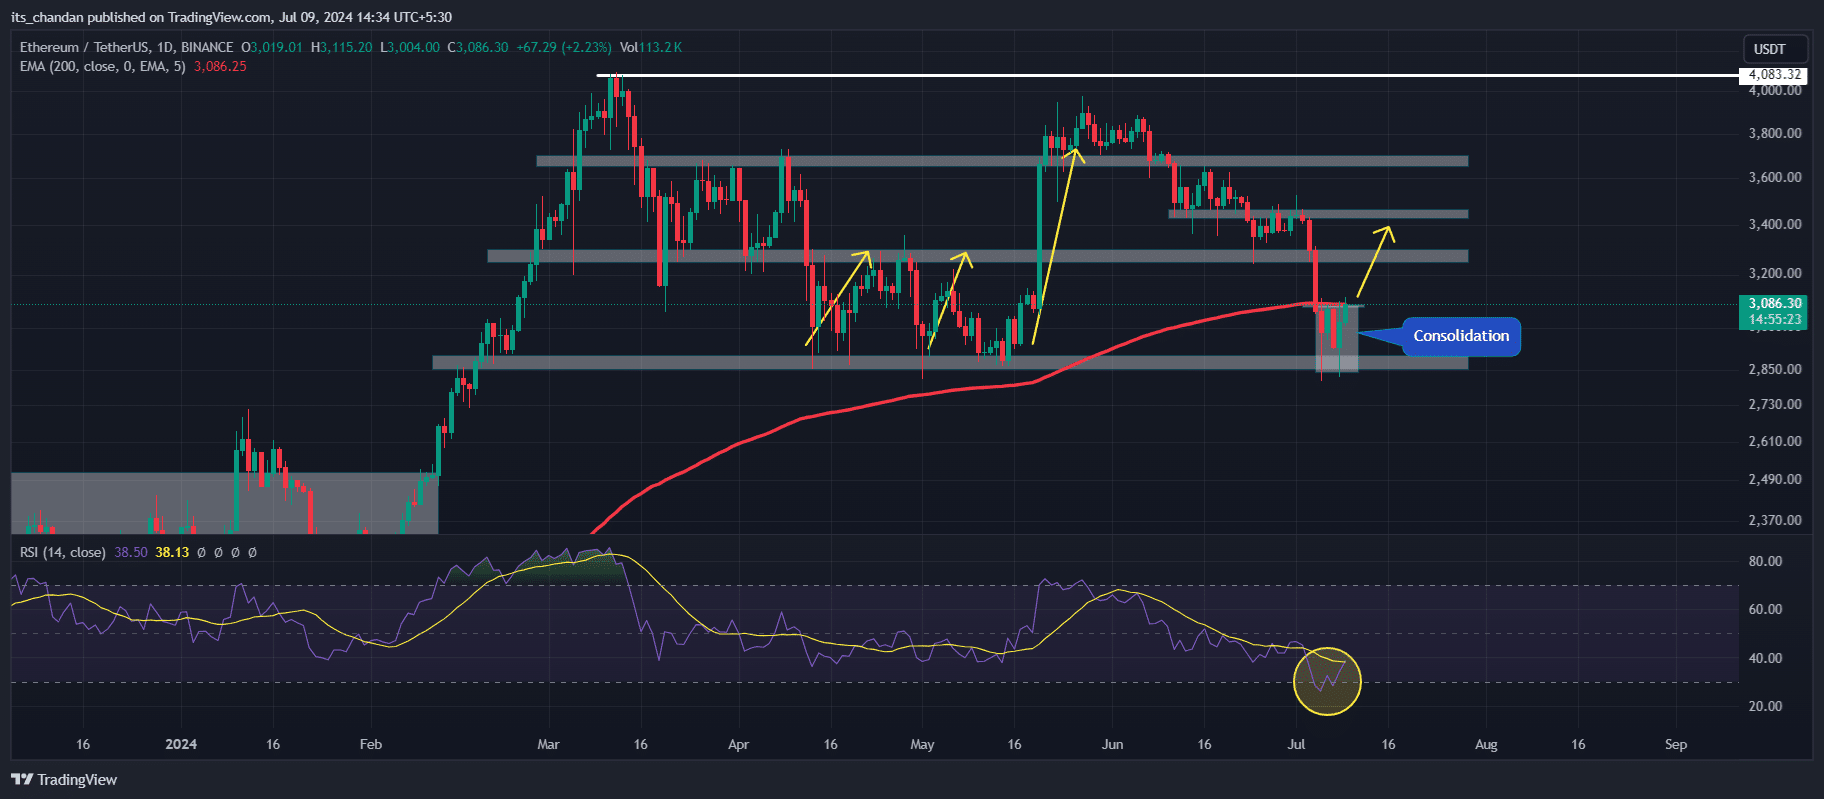
Source: TradingView
Ether’s strong support level and liquidation area
However, ETH has reached this level more than four times since April 2024. Regardless of market conditions, ETH prices have consistently bounced back to either the $3,250 level or the $3,670 level, as shown by historical data on a daily chart.
This time traders expect a similar price surge from this level.
Following the ETF update, ETH’s Open Interest (OI) surged by more than 5.5%, indicating that investor and trader interest and confidence have returned, according to data from an on-chain analytic firm CoinGlass.
Meanwhile, traders liquidated a notable $59.94 million of their positions, out of which bulls have liquidated $23.75 million of long positions and short sellers liquidated a notable $36.16 million of short positions, as per CoinGlass data.
If ETH hits the $3,250 level in the coming days, nearly $165 billion of short position will liquidate. Over the last seven days, short sellers have been expecting that ETH won’t reach the $3,250 level, as per the latest liquidation data from CoinGlass.
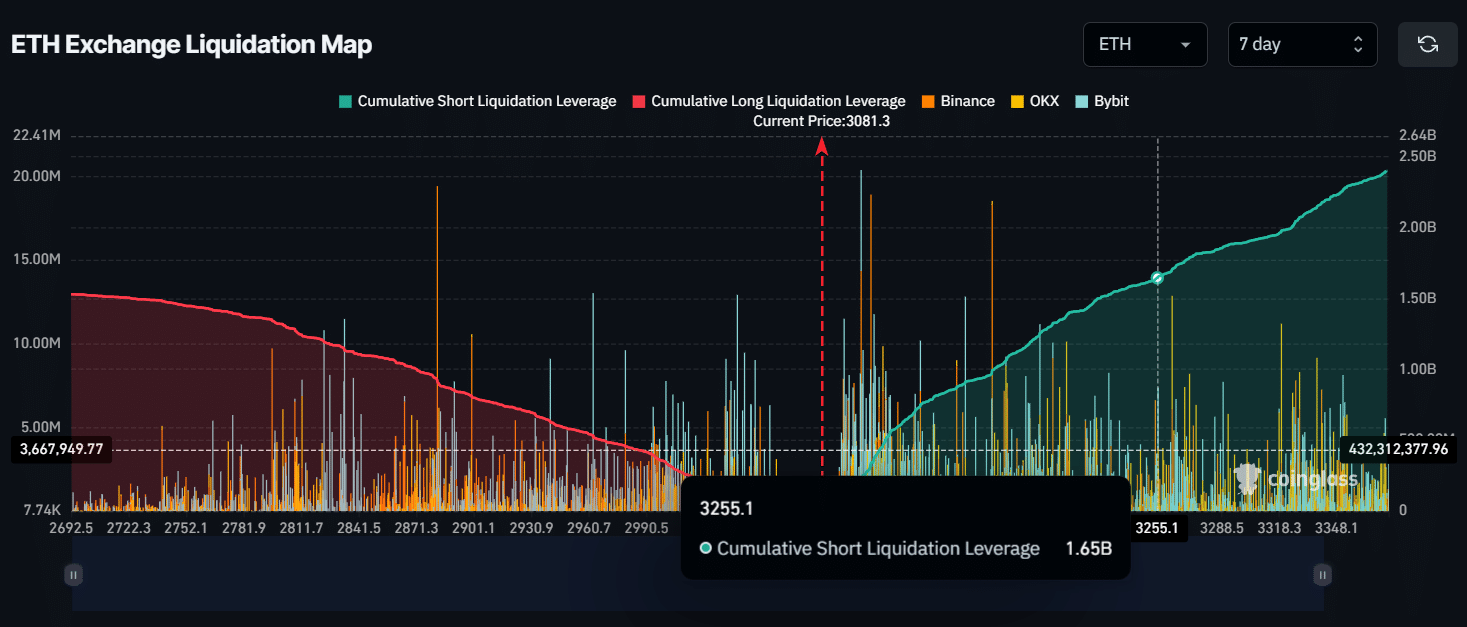
Source: CoinGlass
Read Ethereum’s [ETH] Price Prediction 2024-2025
At press time, ETH was moving near the $3,075 level and it experienced a 5.5% price surge in the last 24 hours.
If we look at the performance of ETH over a longer period, it has lost nearly 10% of its value. Whereas, in the last 30 days, ETH is down by 16%.


![Bonk Coin [BONK]](https://ambcrypto.com/wp-content/uploads/2025/06/Gladys-19-1-400x240.webp)

