Ethereum Classic, Aave, EOS Price Analysis: 18 December

Ethereum Classic registered some gains in the past few hours, at the time of writing. Further, it was testing an area of supply at $35.3. Aave shot upwards from $167 to $200. A pullback for Aave could offer opportunities to open a long position. EOS remained bearish on higher timeframes but continued to hold on to the $3.12 support level.
Ethereum Classic (ETC)
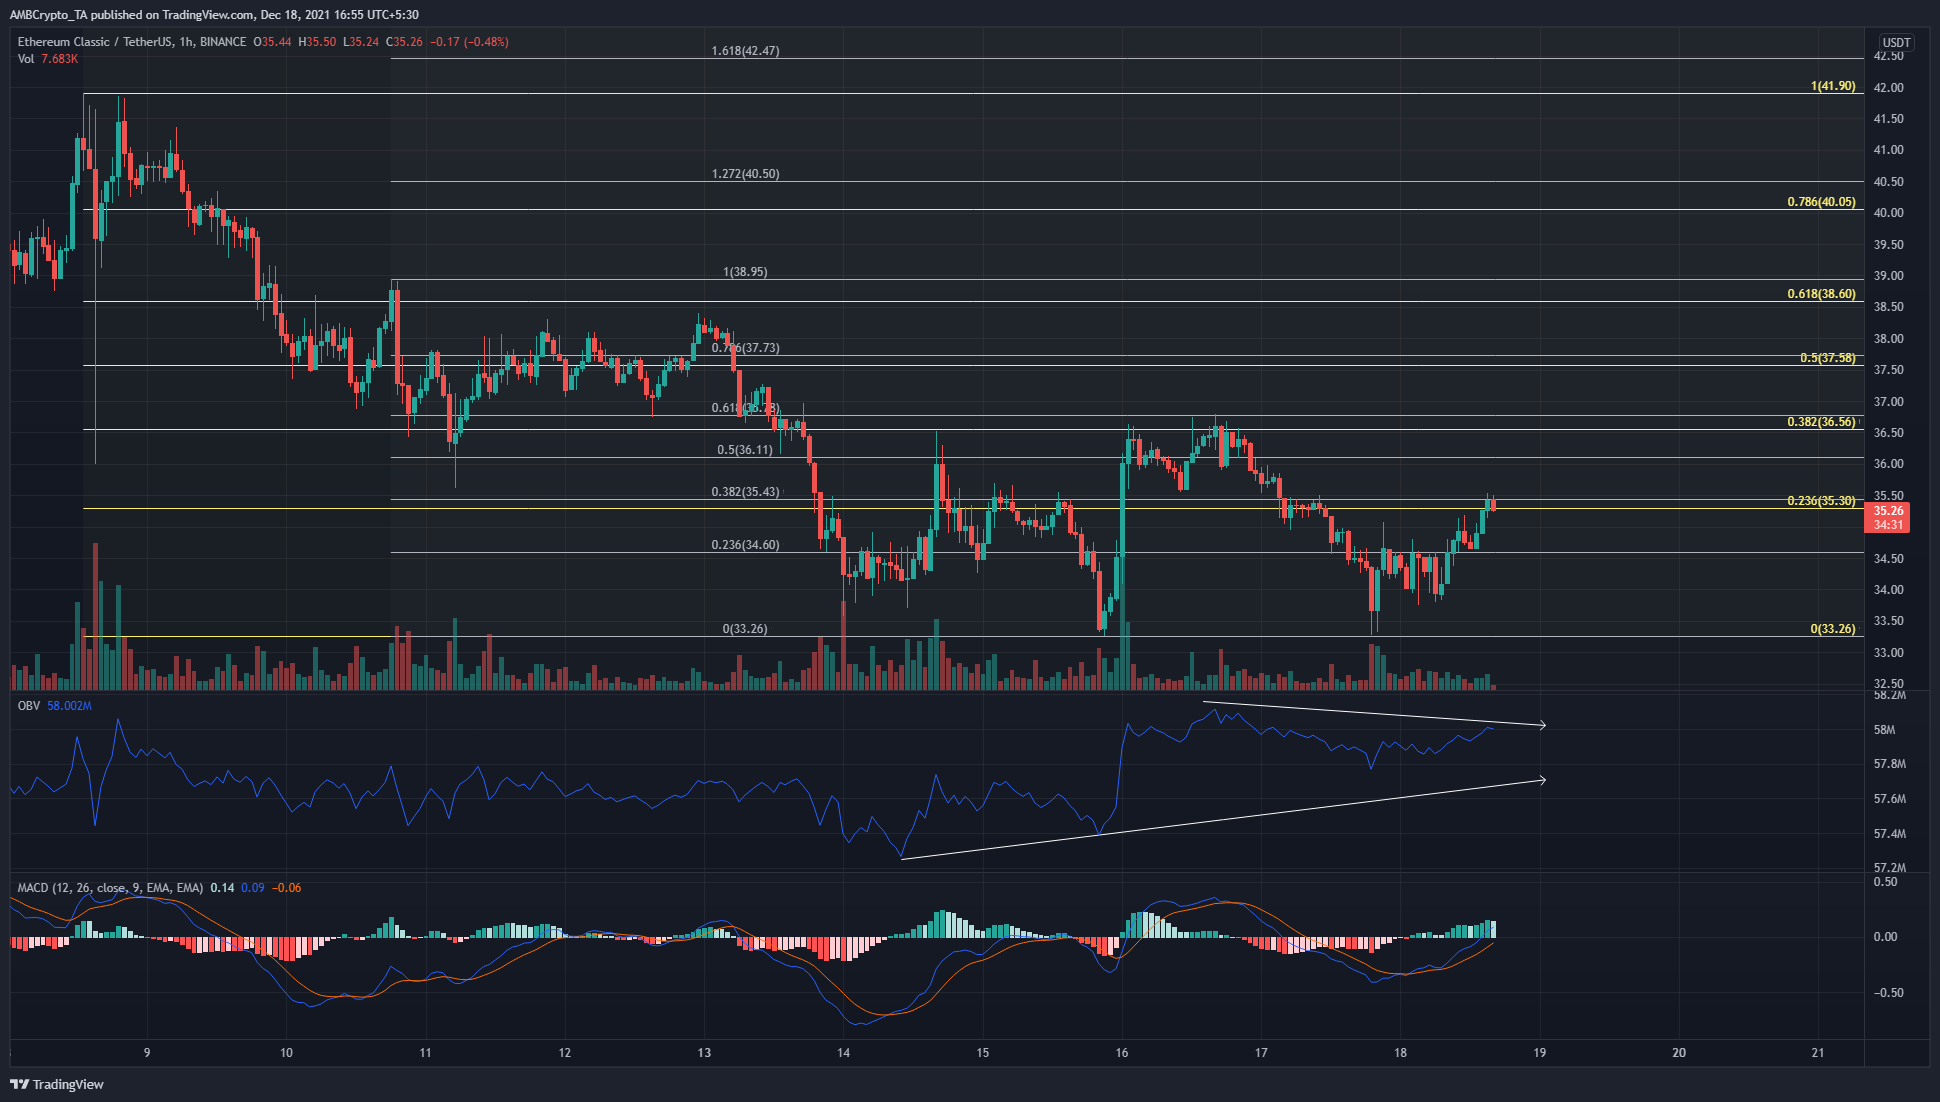
Two sets of Fibonacci retracement lines (gray and yellow) were plotted from different highs to the same swing low at $33.26. Areas on the chart where the Fibonacci retracement lines come close/coincide are strong support/resistance levels.
For ETC, this area lies at $35.3, $36.5, and $37.6. Over the past few days, the OBV has made higher lows, an indication of buyers stepping in near the $33 zone, but has been unable to register higher highs. The MACD was also nearing a zero-line crossover, indicating a strengthening bullish momentum.
If $35.3 is flipped to support, long positions can be opened, targeting the aforementioned Fib levels as take-profit areas. However, this setup needs Bitcoin to move sideways or climb higher in the next few days.
Aave (AAVE)
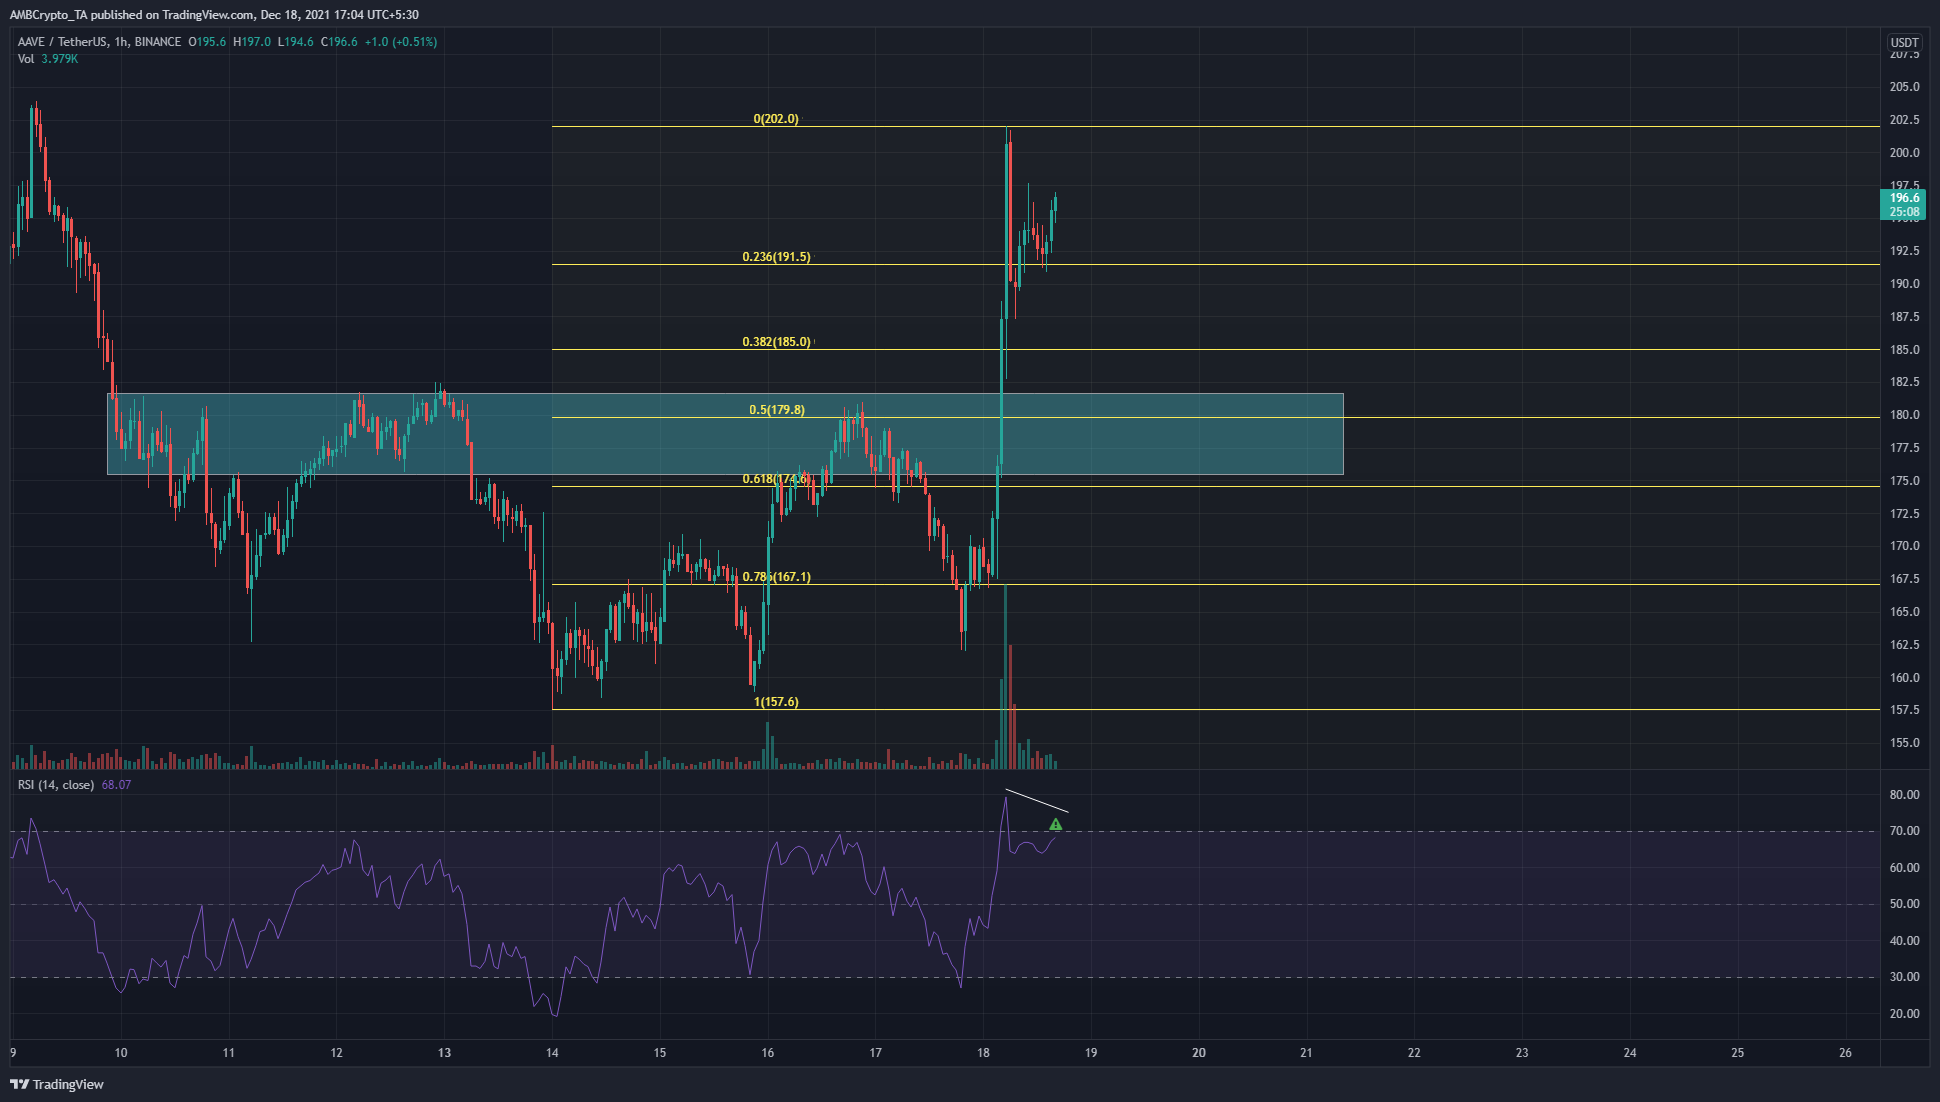
The cyan box represents an area on the charts that price has spent considerable time inside, in recent days. The most recent move upward for AAVE was explosive and broke straight past this area. This means that this area, alongside the 50% and 61.8% retracement levels, are places that offer good risk/reward ratio for traders looking to enter longs.
Price seeks liquidity, and the cyan box represents liquidity. A possible bearish divergence on the RSI, if it develops, will indicate a pullback. If the price doesn’t retest this low timeframe liquidity pocket, it would show extreme bullishness behind AAVE.
EOS

On the 4-hour chart, the outlook for EOS remained bearish. It has formed higher lows in recent days but is yet to break past the trendline resistance. The Chaikin Money Flow also showed capital leaving the market, meaning sellers were out in force.
The DMI showed a bearish trend in progress, although the ADX (yellow) was only barely above the 20 value, commonly used to filter significant trends from insignificant ones.
$3.4 and $3.12, alongside the trendline resistance, are important areas for EOS in the days to come.