Ethereum Classic bulls eye $23.8 amid short-term volatility fears
The long liquidations below $20 could see ETC dip southward before the breakout past $22.

- Ethereum Classic regained its bullish market structure on the daily after a 20% rally
- Liquidity levels indicate that a pullback below $20 is likely before a move beyond $22
Ethereum Classic [ETC] has performed well since the 4th of November. Alongside Bitcoin [BTC], the altcoin has posted 19% gains since the lows of that day at $17.29.
Despite the recent gains, it was still unable to rise beyond the local highs at $21 that have opposed the buyers since August. Will this move be different?
Accumulation indicator shows breakout is likely
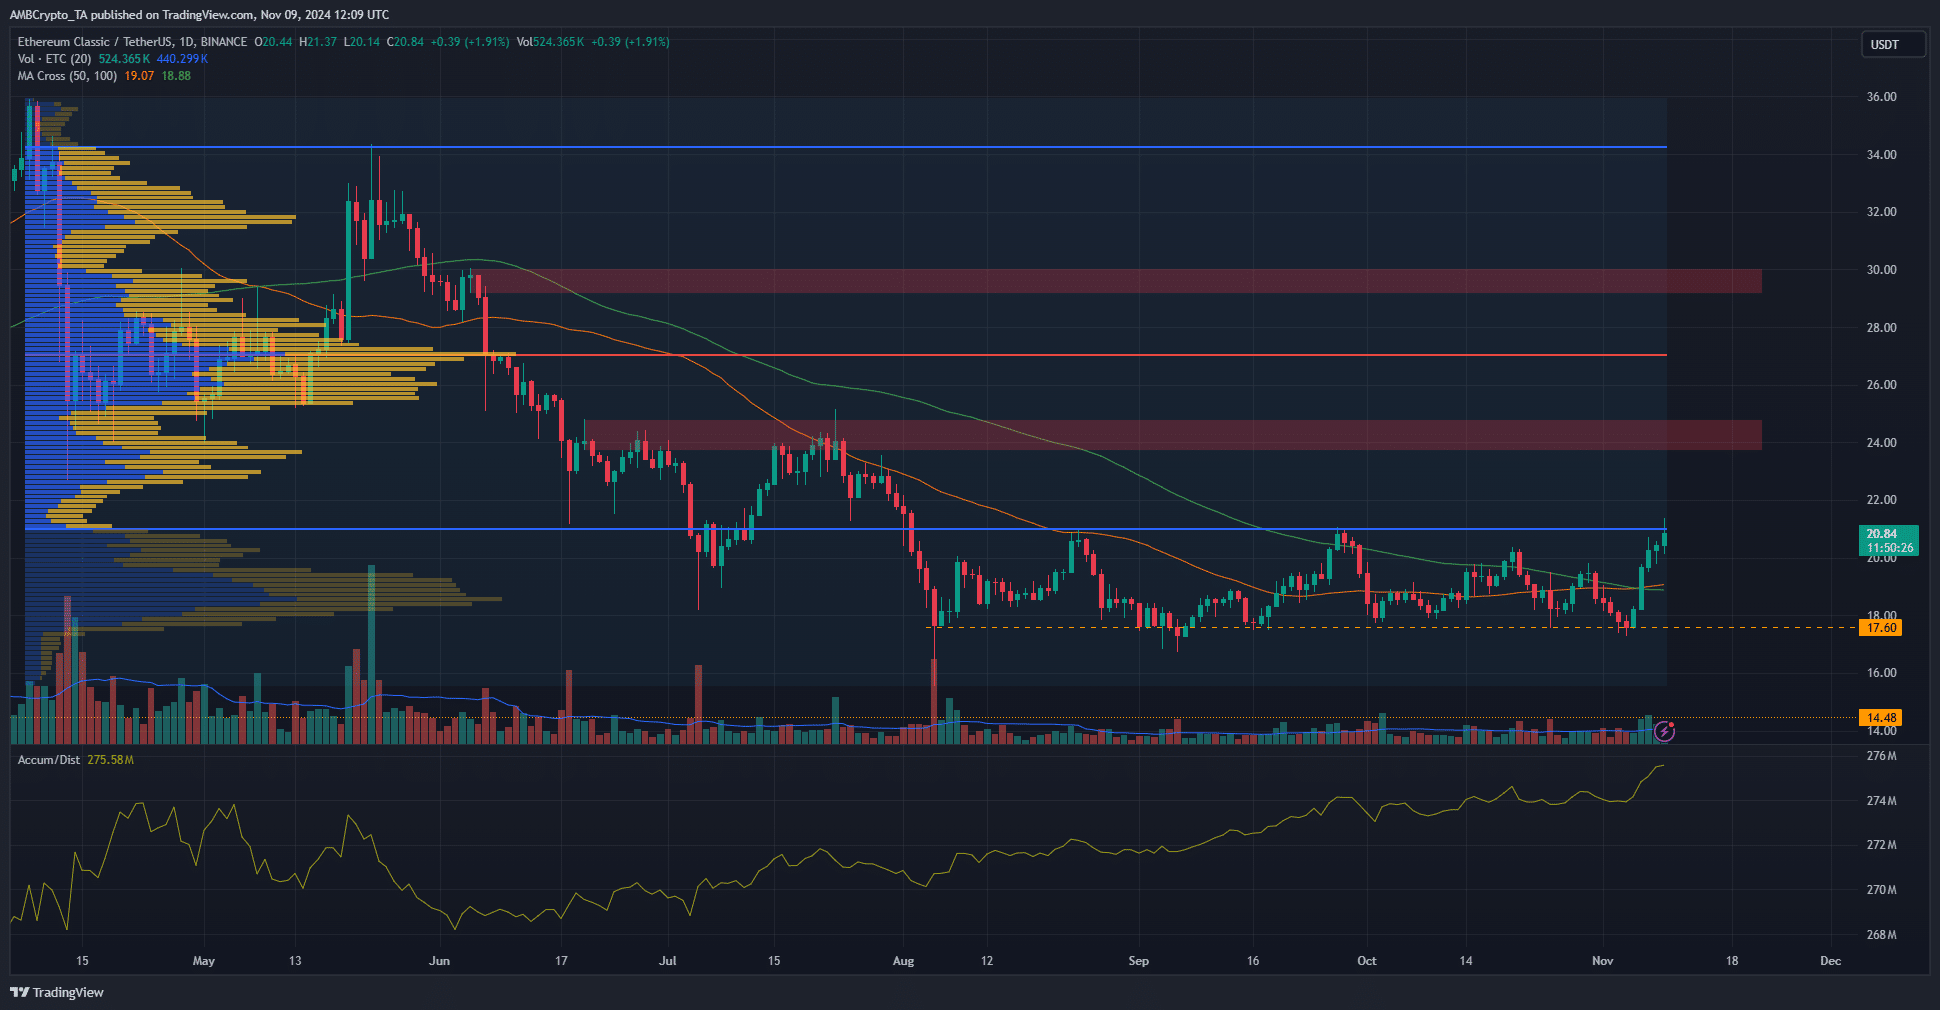
The market structure had turned bullish on the daily chart earlier this week after the move beyond the recent lower high at $19.82.
The A/D indicator was in a steady uptrend since August, while the price formed a range between $17.6 and $21.
With the sentiment across the crypto space growing increasingly bullish, ETC is likely set to break past the $21 level. The Fixed Range Volume Profile showed that the $21 level was a stern resistance.
It formed the lower band of the value area, where 70% of the trading volume since April has taken place. Breaking into the value area has been a challenge.
The 50 and 100-period moving averages formed a bullish crossover, another sign that an uptrend is increasingly likely.
The next significant resistance zone beyond $21 was at $23.8. A bearish order block and a high-volume node were both present in this area.
Short-term sentiment favors ETC bulls
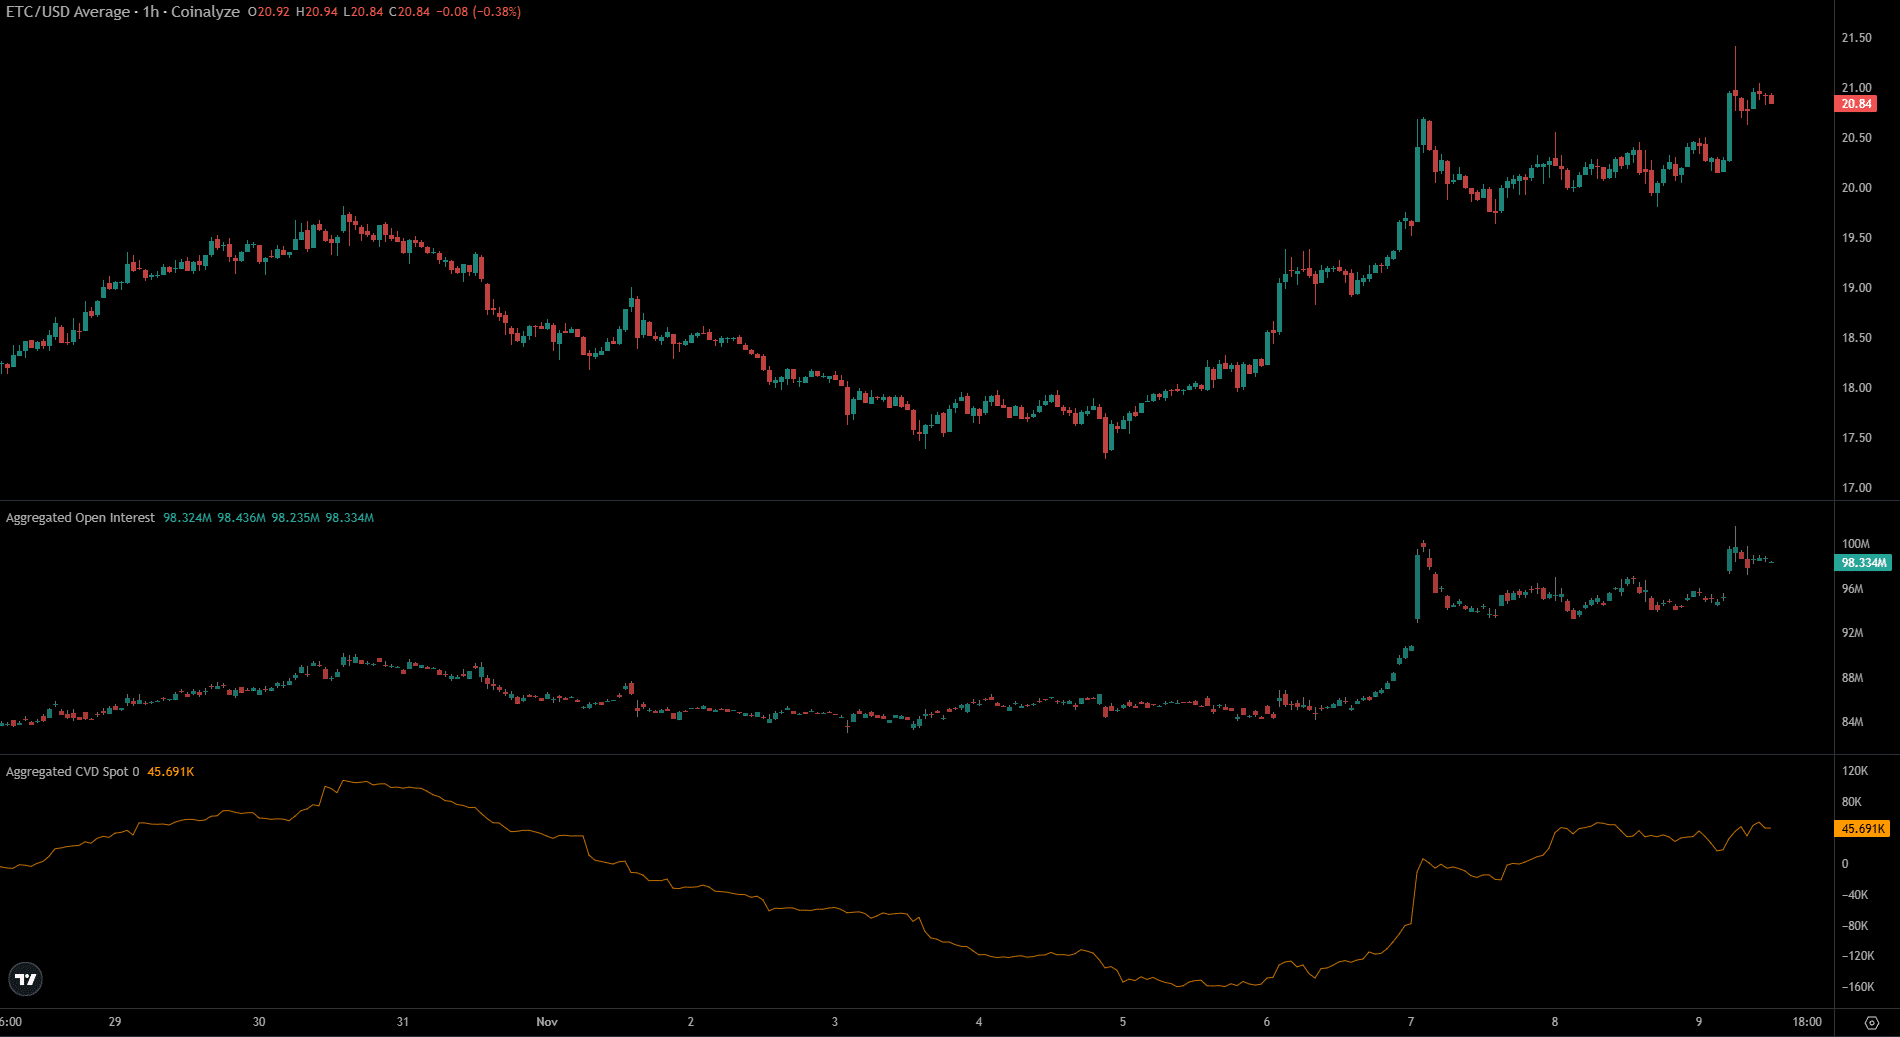
The Open Interest surged from $86 million on the 6th of November to $98.3 million at press time, while the price rallied 20%. This showed bullish sentiment amongst speculators.
The spot CVD also climbed higher in recent days, showcasing demand in the spot markets.
Read Ethereum Classic’s [ETC] Price Prediction 2024-25
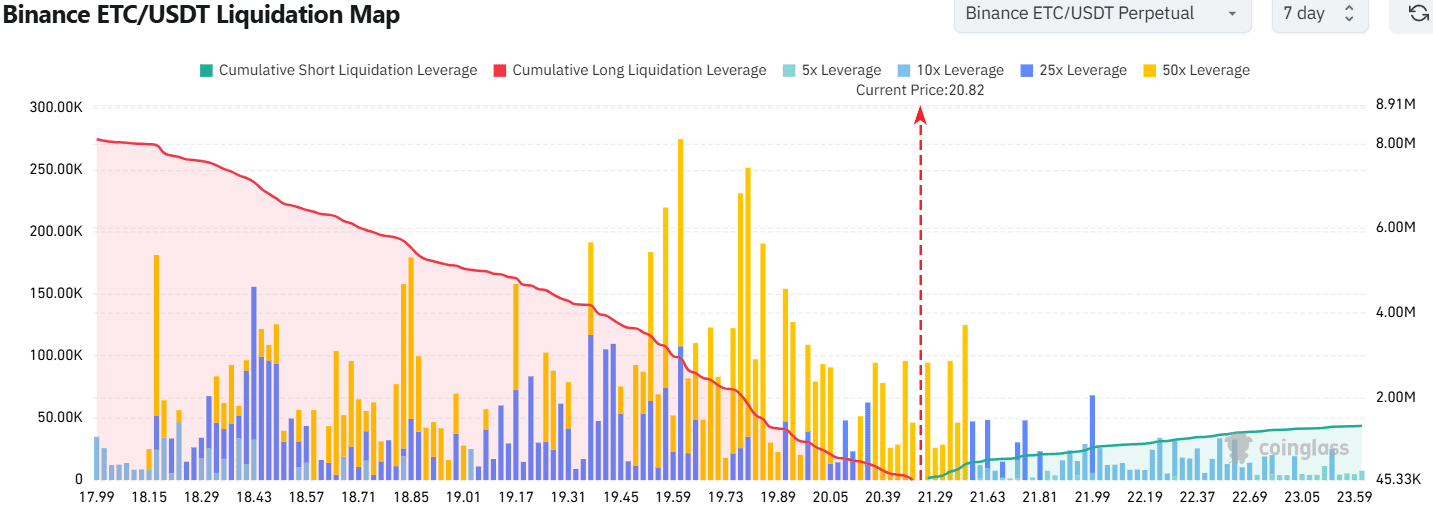
The ETC liquidation map showed that a retracement to $19.61 and $19.37 would cause a high volume of long liquidations. To the north, relatively smaller liquidity pools were present, up to $21.99.
Since liquidity attracts prices, ETC might witness a dip below the $20 mark to trigger these long liquidations in the coming days.
Disclaimer: The information presented does not constitute financial, investment, trading, or other types of advice and is solely the writer’s opinion