
The global cryptocurrency market has surged over the last 24 hours. Altcoins like Ethereum classic, Chainlink, and Avalanche seemed to oblige the price trajectory of the market’s leading cryptocurrencies.
Ethereum Classic [ETC]
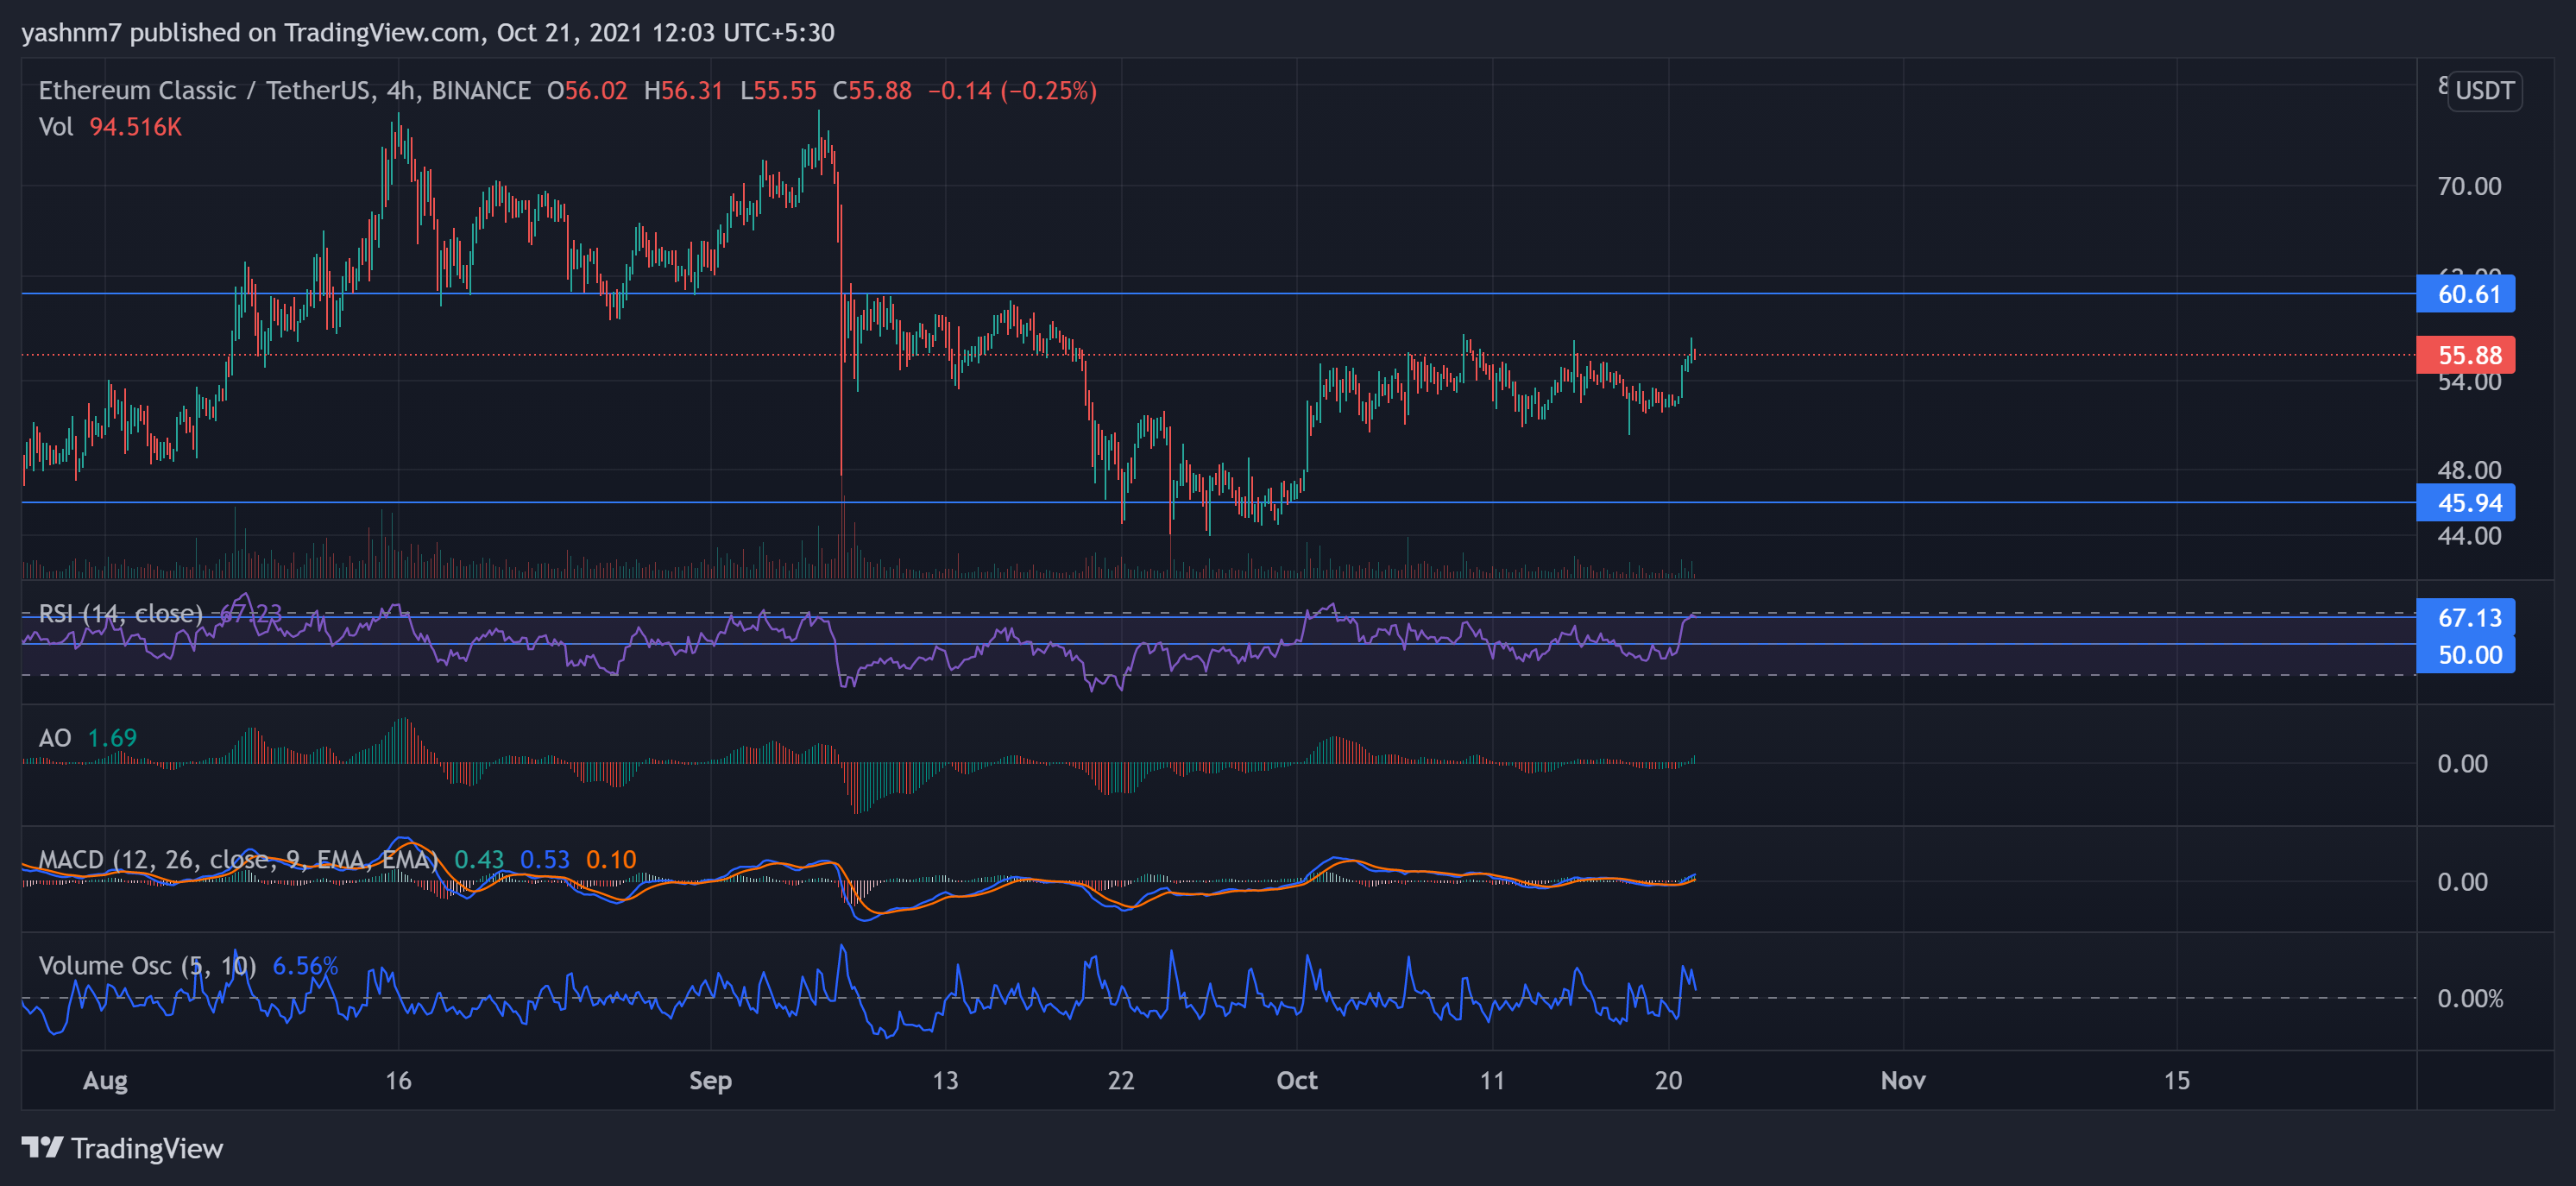
Source: TradingView, ETC/USDT
ETC noted a hike of 6.72% over the last 24 hours and was trading at $55.88, at the time of writing. The support level stood at $45.94, while the overhead resistance was registered at $60.61. Key indicators pointed to recent bullish price action in the market.
The RSI was near the 67-mark, signaling that buying strength existed in the market. If the RSI further inches close to the 70-mark, a trend reversal, in that case, can’t be ruled out.
The MACD, with its green signal bars, approached a bullish crossover. Both the MACD and the Awesome Oscillator flashed green signs in favor of the buyers, thus highlighting bullish price action. However, the Volume Oscillator noted a decrease in the trading volume, signaling a possible reversal in the near term.
Chainlink [LINK]

Source: TradingView, LINK/USDT
LINK appreciated by 5.18% over the same time period. At press time, it was trading near its immediate resistance level that stood at $27.94. The token’s support line was capped at $23.88.
The RSI stood nearly at the 61-mark, indicating the market’s preference for buyers in recent times. The green signal bars flashed by the MACD and the Awesome Oscillator further confirmed this preference.
However, the Volume Oscillator depicted a fall in trading volumes, showing the possible easing of bullish momentum.
Avalanche [AVAX]

Source: TradingView, AVAX/USDT
AVAX surged by 8.34% in the last 24 hours. After a breakout from its immediate resistance level that stood at $62.41 a day before, the altcoin was trading at $62.03. Key indicators pointed to the existence of superior buying strength.
The Awesome oscillator was above the zero line and flashed green signal bars. This reading underlined an inclination for the bulls. The MACD approached a bullish crossover, one which highlighted that buyers have a suitable market.
If the MACD progresses further in bullish territory, it would imply that sellers might have difficult days ahead.
The RSI was in the overbought territory, picturing very high buying pressure. It also indicated that a trend reversal might follow soon.
However, the Volume Oscillator seemed to head south, stating the possibility of a further fall in trading volumes.