Ethereum Classic could see these levels before a possible lift-off

Disclaimer: The findings of the following analysis are the sole opinions of the writer and should not be considered investment advice
Ethereum Classic (ETC) saw a substantial depreciation in its value by withdrawing in a descending channel (yellow) for nearly 16 weeks. During the downfall, the 20 SMA (red) assumed an important area of value for traders/investors.
From here on, ETC saw a patterned breakout on 7 February but failed to gain stimulus as it eyed an approach to the $28-zone after a bearish divergence with its daily RSI.
At press time, ETC was trading at $31.06, down by 4.5% in the last 24 hours.
Ethereum Classic Daily Chart
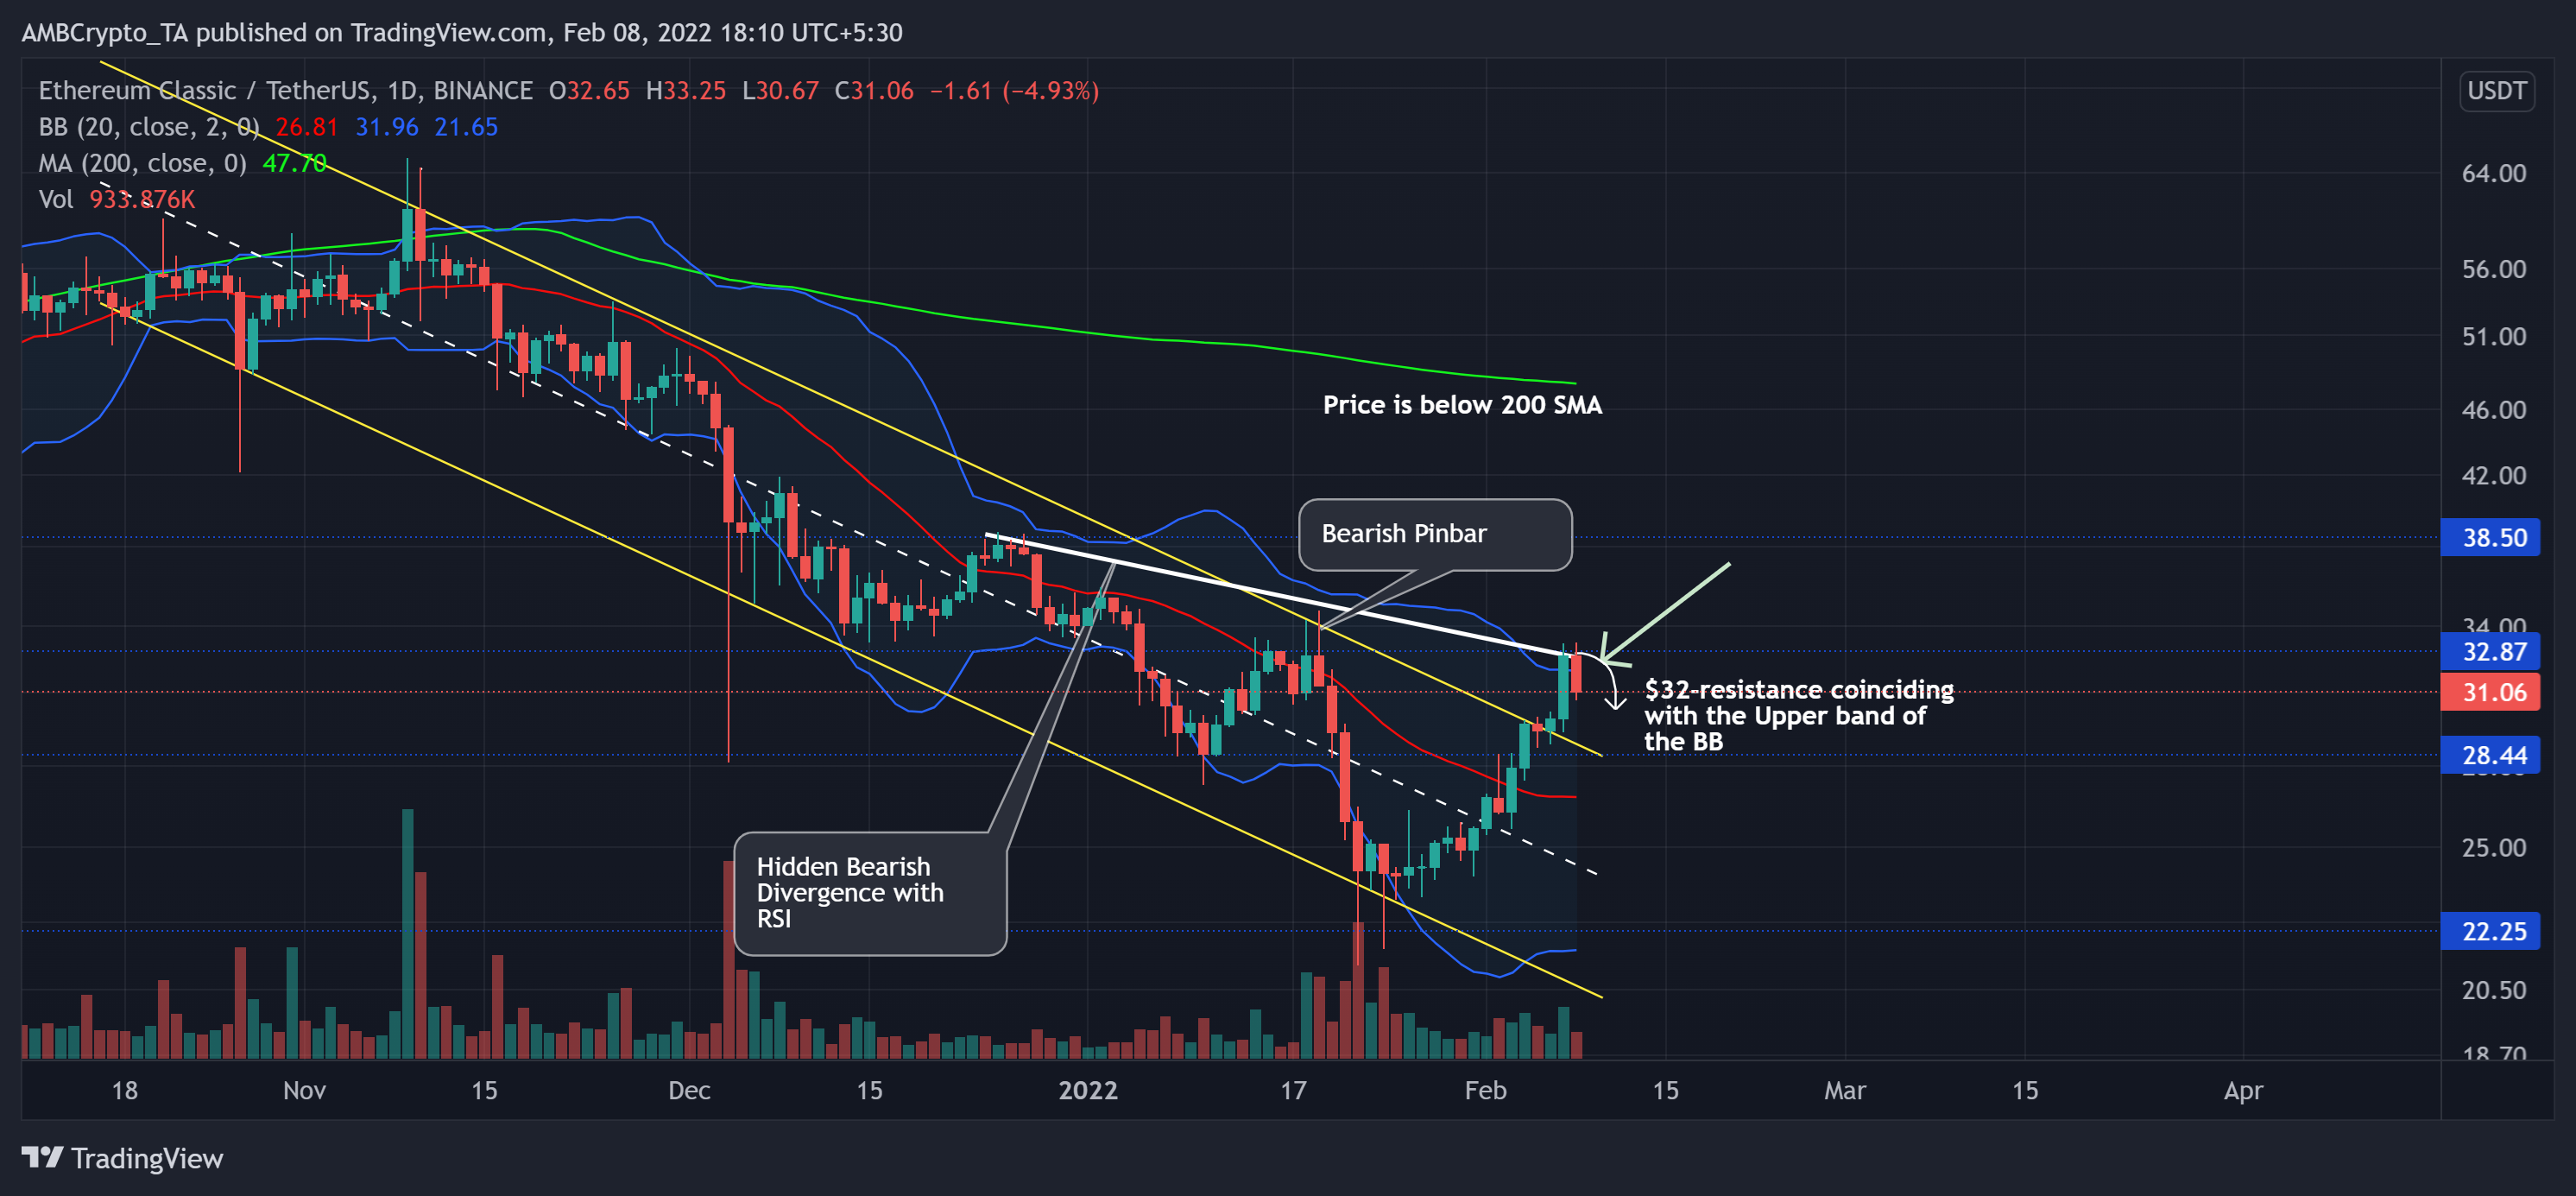
The latest bearish phase for the altcoin saw a nearly 67.4% retracement as it pierced through numerous vital price points. For instance, the bears managed to flip the $32-mark from its nine-month support to immediate resistance. Thus, revealing a dominant bearish influence.
Interestingly, ETC noted a 42.62% ROI (from 26 January), one that helped it breach the pattern and test the $32-mark resistance on 7 February. But, it struggled to gather force and overturn this level.
Thus, despite recent gains, ETC saw a reversal from the upper band of the Bollinger Bands (BB). It also coincided with the immediate resistance. To top it up, ETC formed a bearish divergence with the RSI, due to which the price action saw a reversal on 8 February.
This trajectory would also mean that the altcoin will finally change its relationship with the 20 SMA from resistance to support. Consequently, a test of the immediate support at the $28-level or the 20 SMA would be likely before a bullish move.
In case of a bearish malfunction or a change in Bitcoin’s perception, the bulls could stall the sell-off and initiate an immediate test of the $32-mark.
Rationale
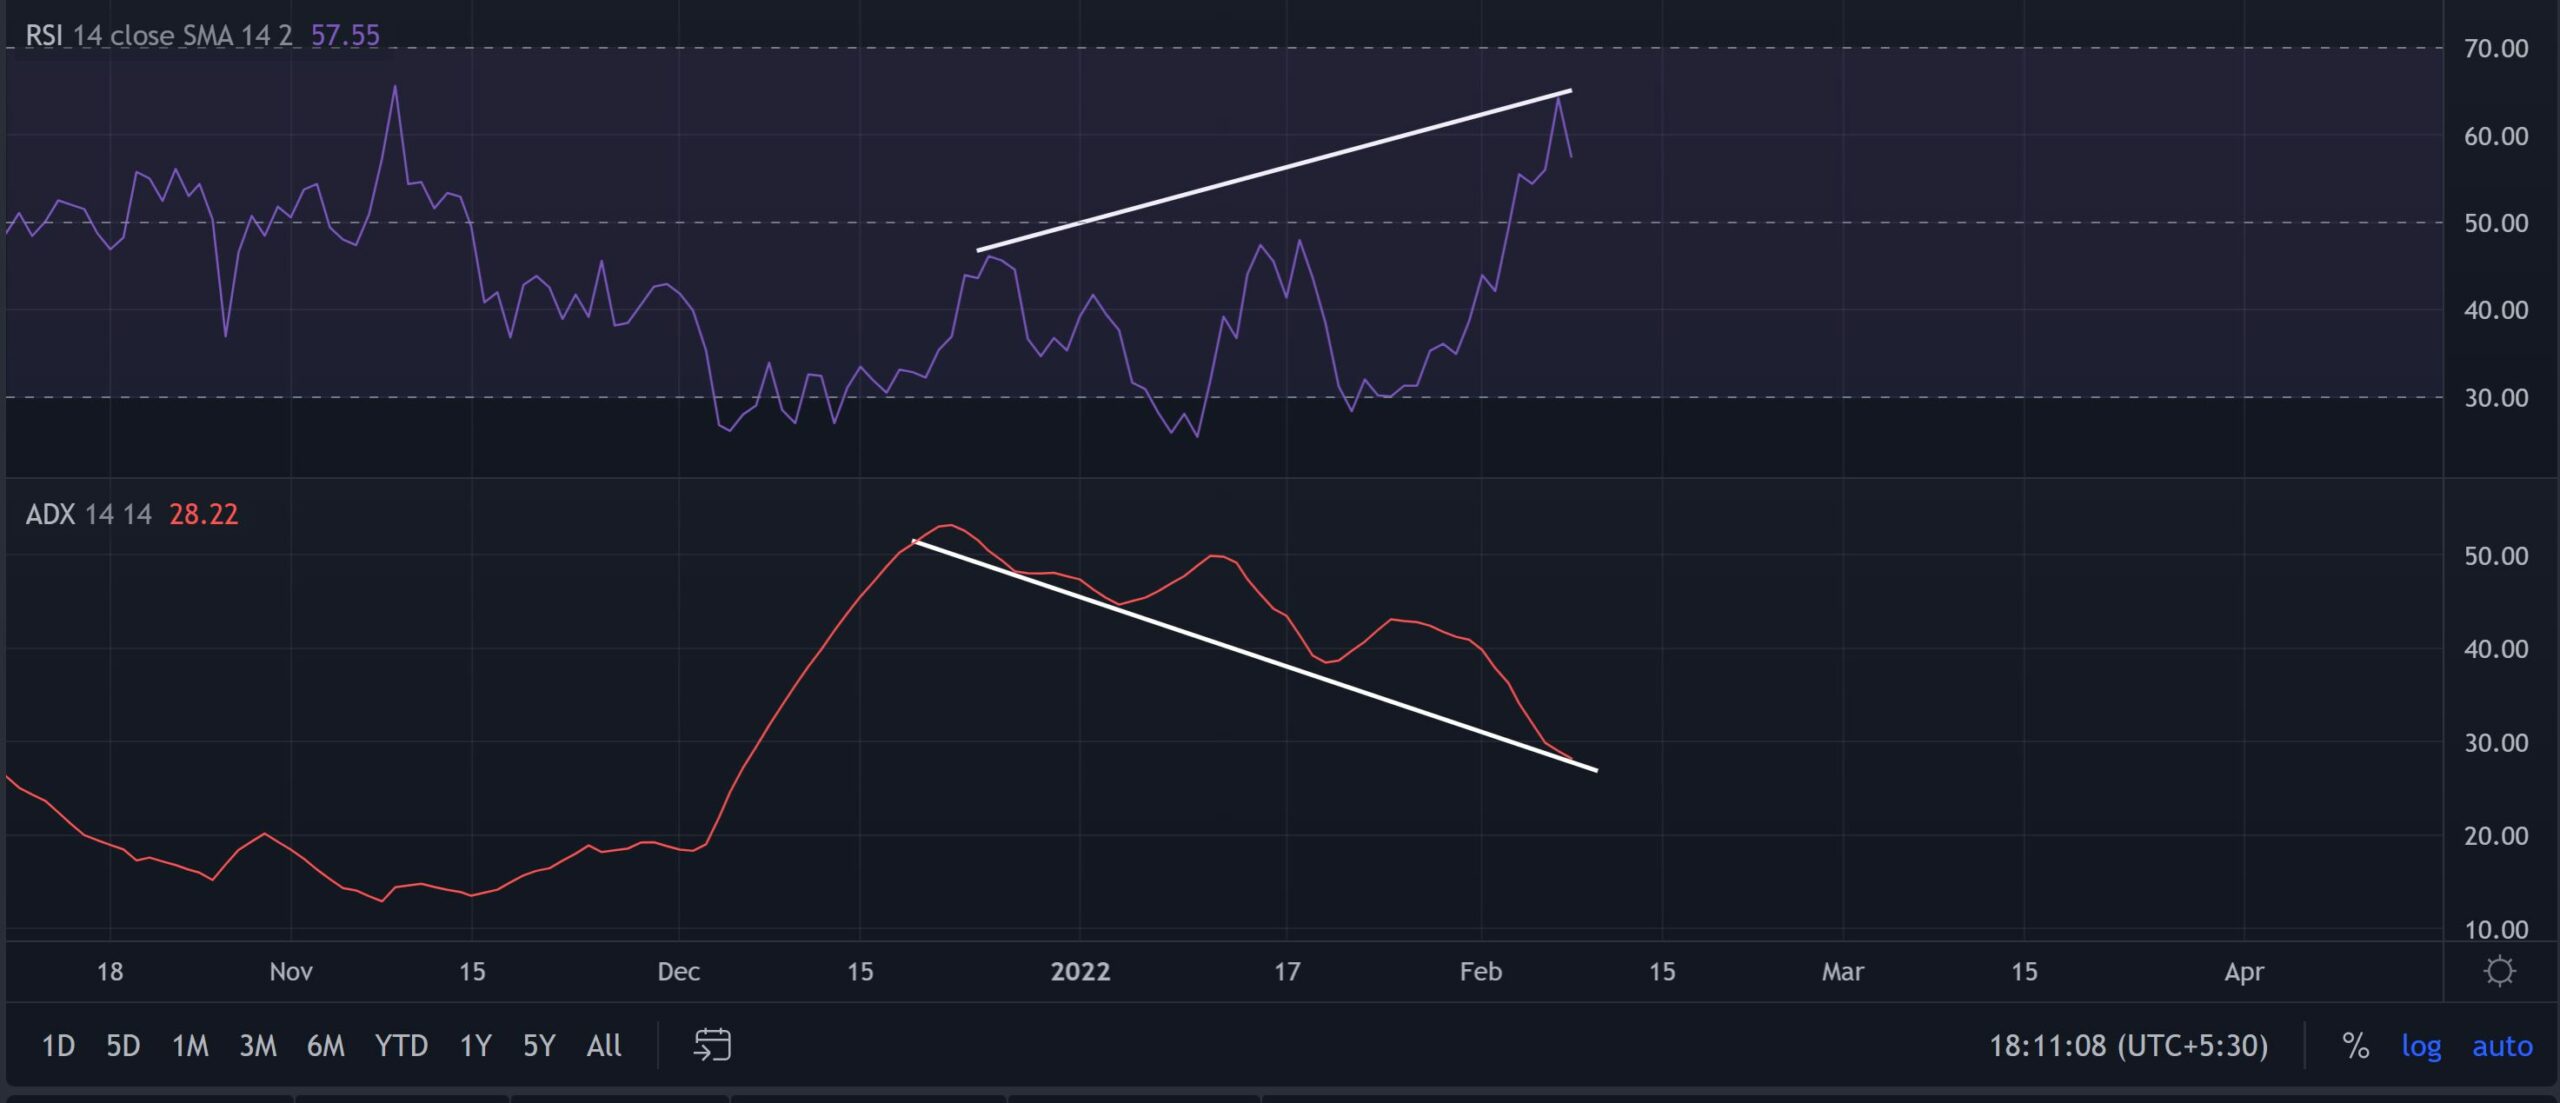
Although the RSI crossed the midline, it saw a strong trendline resistance. The bulls still need more thrust to counter the long-term bearish tendencies.
Having said that, the ADX has been on a steady decline, meaning the strength of its direction is getting weaker. The bulls could capitalize on this ramping up volumes and jump the gun by closing above the $32-mark.
Conclusion
Considering the overbought readings on the BB and the hidden bearish divergence with the RSI, ETC needs to brace itself for a likely retest near its 20-period MA (Mean of BB).
Thus, although ETC saw a long-term patterned breakout, a retest near the $28-$26-zone would be likely before a possible uptrend.


