Ethereum Classic [ETC]: The next buying opportunity can be found at…

Disclaimer: The findings of the following analysis are the sole opinions of the writer and should not be considered investment advice
Ethereum Classic has a bullish outlook for the next few weeks. Even on a longer timeframe, Ethereum Classic is at a place that offers a great risk-to-reward buying opportunity. The $34-$36 area presents an area of demand, one which has been an area of resistance since December.
The price shot past this area in late March. At the time of writing, it had revisited this area in search of demand.
Ethereum Classic – 12 Hour Chart
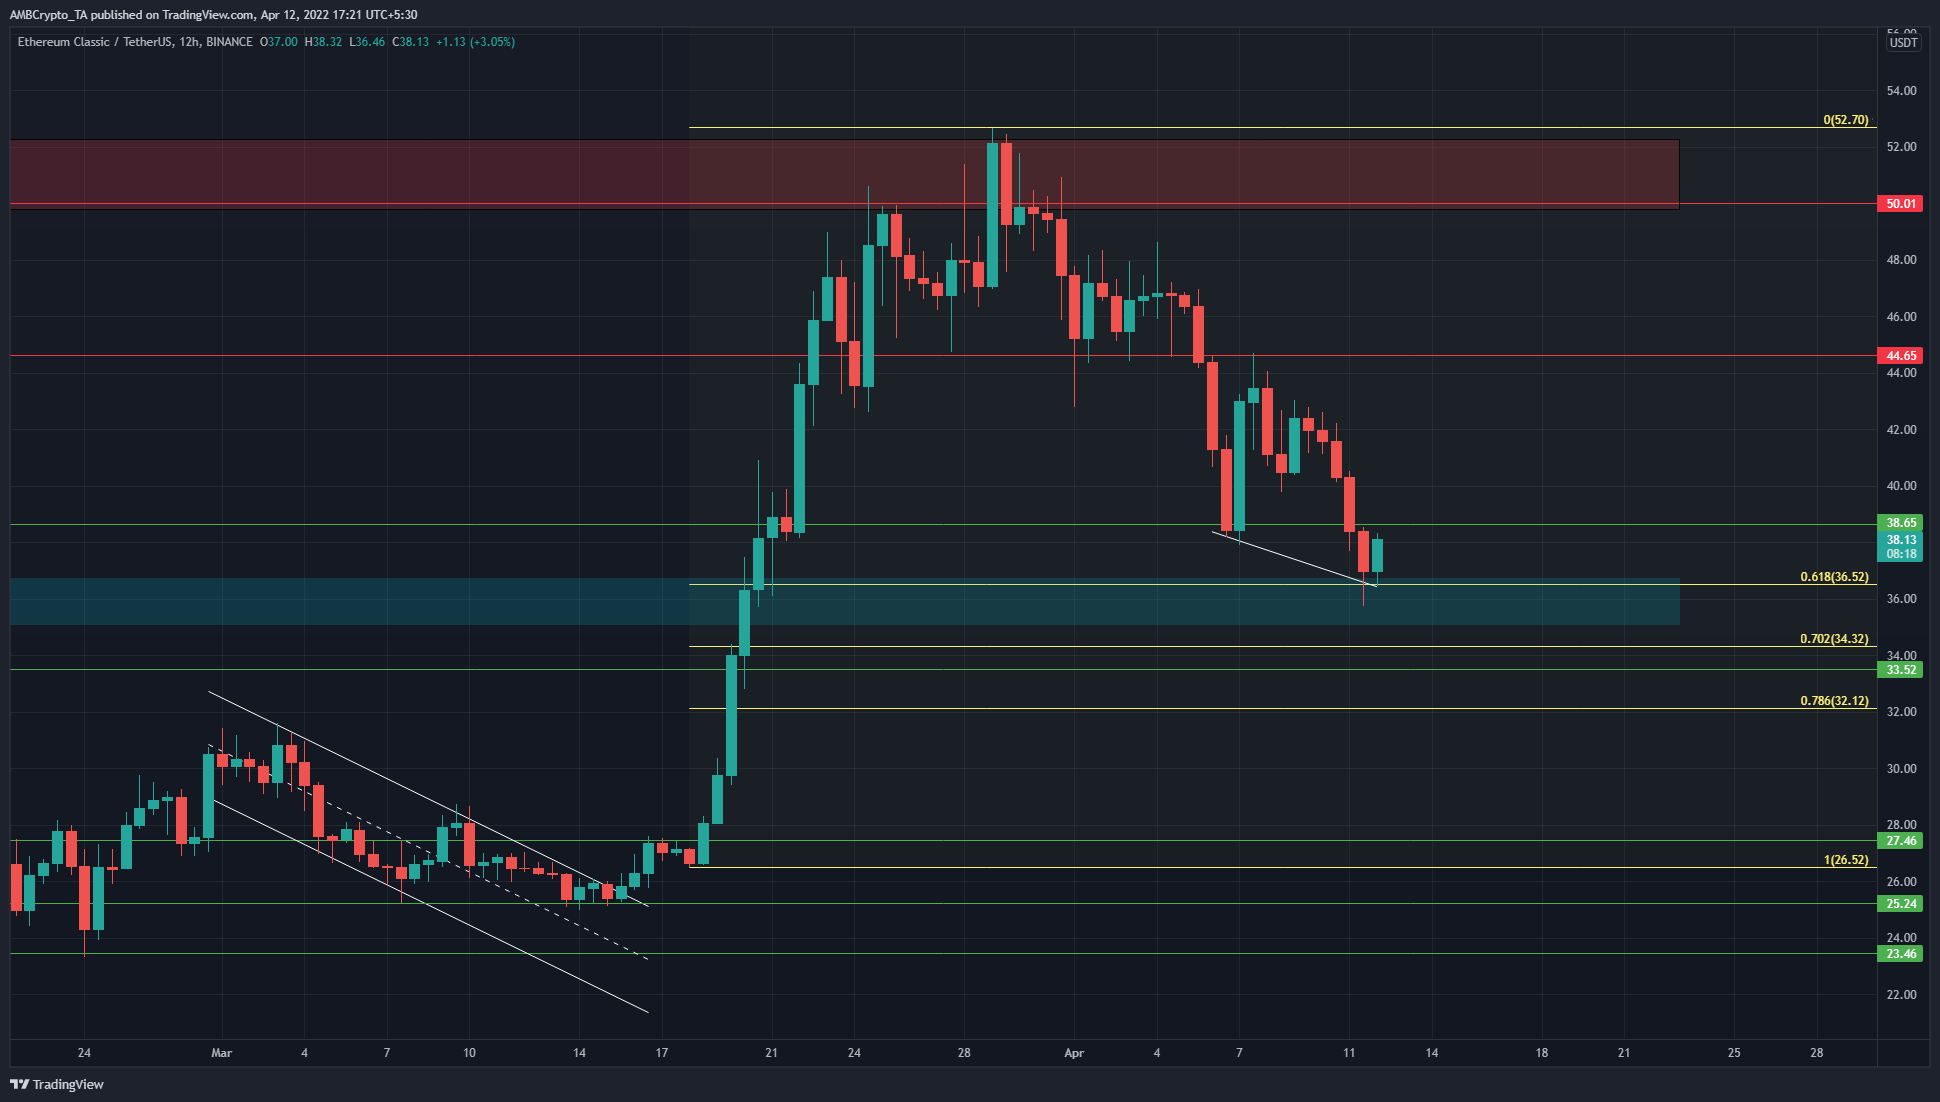
Based on the move from $26.52 to $52.7, a set of Fibonacci retracement levels was plotted (yellow). The 61.8% retracement level lies at $36.52. The entire area from 61.8%-78.6% is technically a buying opportunity as strong moves retrace to certain percentages before a resumption of the former trend.
Moreover, going back to mid-December, the $35-$36.5 zone has been an area of resistance. At the time of writing, the price had retested this area and found some demand. Going forward, a move upward can be initiated from the $36-area.
For long-term investors, so long as the price doesn’t dip below $32.12, a buying opportunity can still present itself. $36.52, $33.52, and $32.12 are levels that can be expected to act as support, should ETC see a further dip.
Rationale
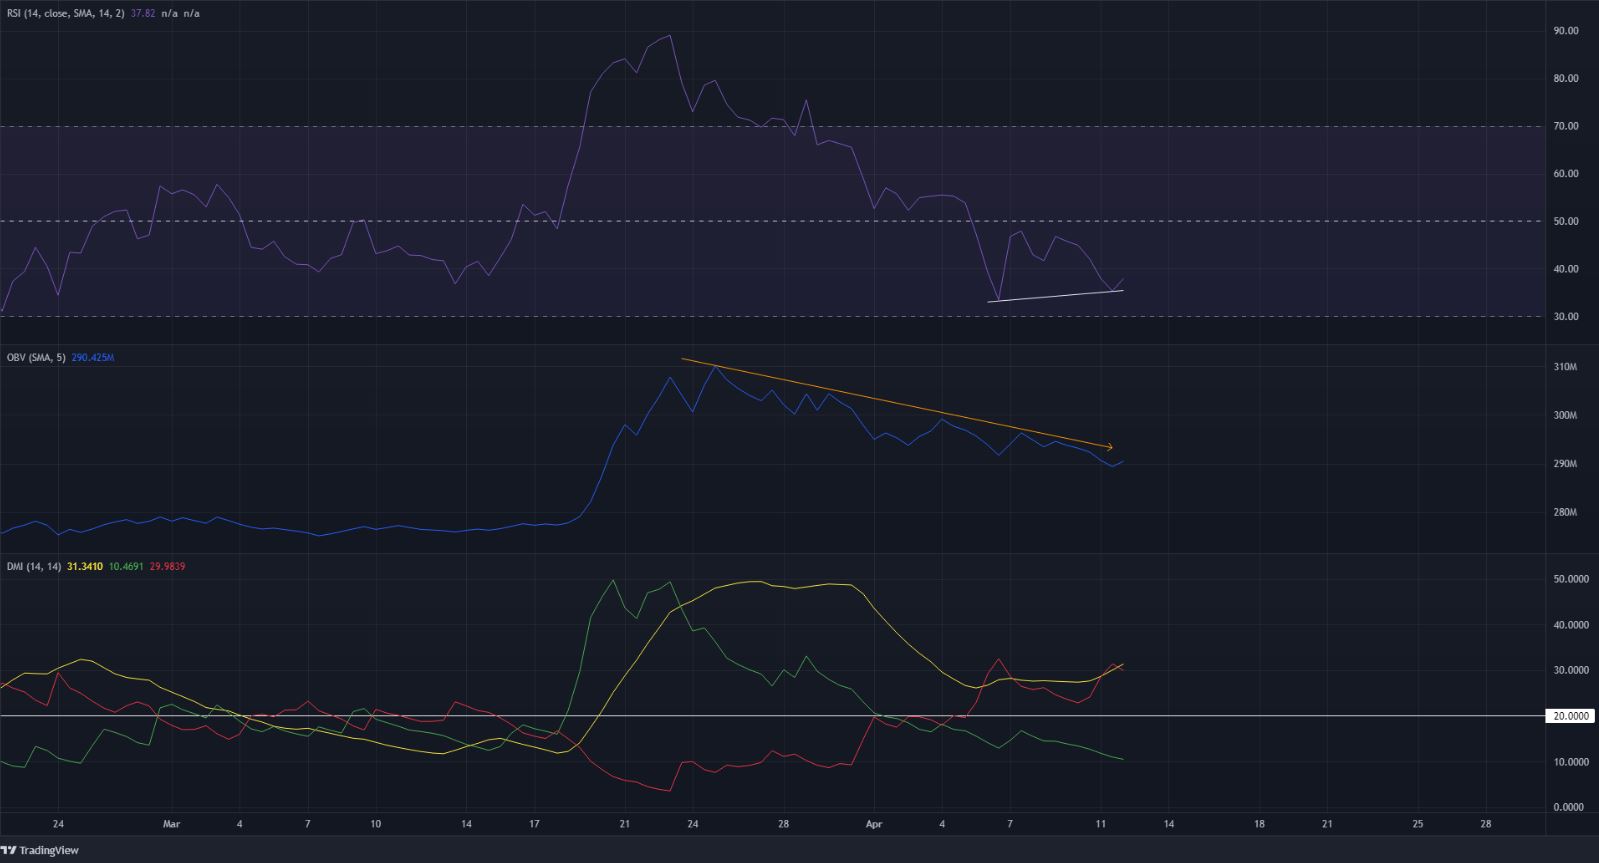
On the 12-hour chart, the RSI flashed a regular bullish divergence just as the price tested a zone of demand. Hence, a bounce in price could be imminent. On the other hand, the DMI pictured a strong bearish trend in progress. The ADX (yellow) and -DI (red) were both above 20.
The OBV has been on a downtrend as the price pulled back, however, the buying volume when the price broke out past $36 was quite high. If the OBV can continue to climb higher, alongside the price, it would be an indication of a genuine upward move.
Conclusion
The price had retraced to a zone of demand at $36, and a bullish divergence was spotted. A retest of this zone in the next few days can be a buying opportunity. Similarly, a move above $38.65 and its retest as support can also be a buying opportunity.


