Ethereum Classic [ETC]: Two important levels that could offer profitable trades

Disclaimer: The findings of the following analysis are the sole opinions of the writer and should not be considered investment advice
Bitcoin saw volatility inside a range it has been trading within for nearly a month now. It faced stern rejections each time it tried to climb above the $31.5k-$32k mark, and a bullish bias was not apparent for most of the crypto market as well. Ethereum Classic also formed a range over the past three weeks, and in the last few days of trading, the price has fallen beneath a support level as well. Could the range lows be revisited once again?
ETC- 2 Hour Chart
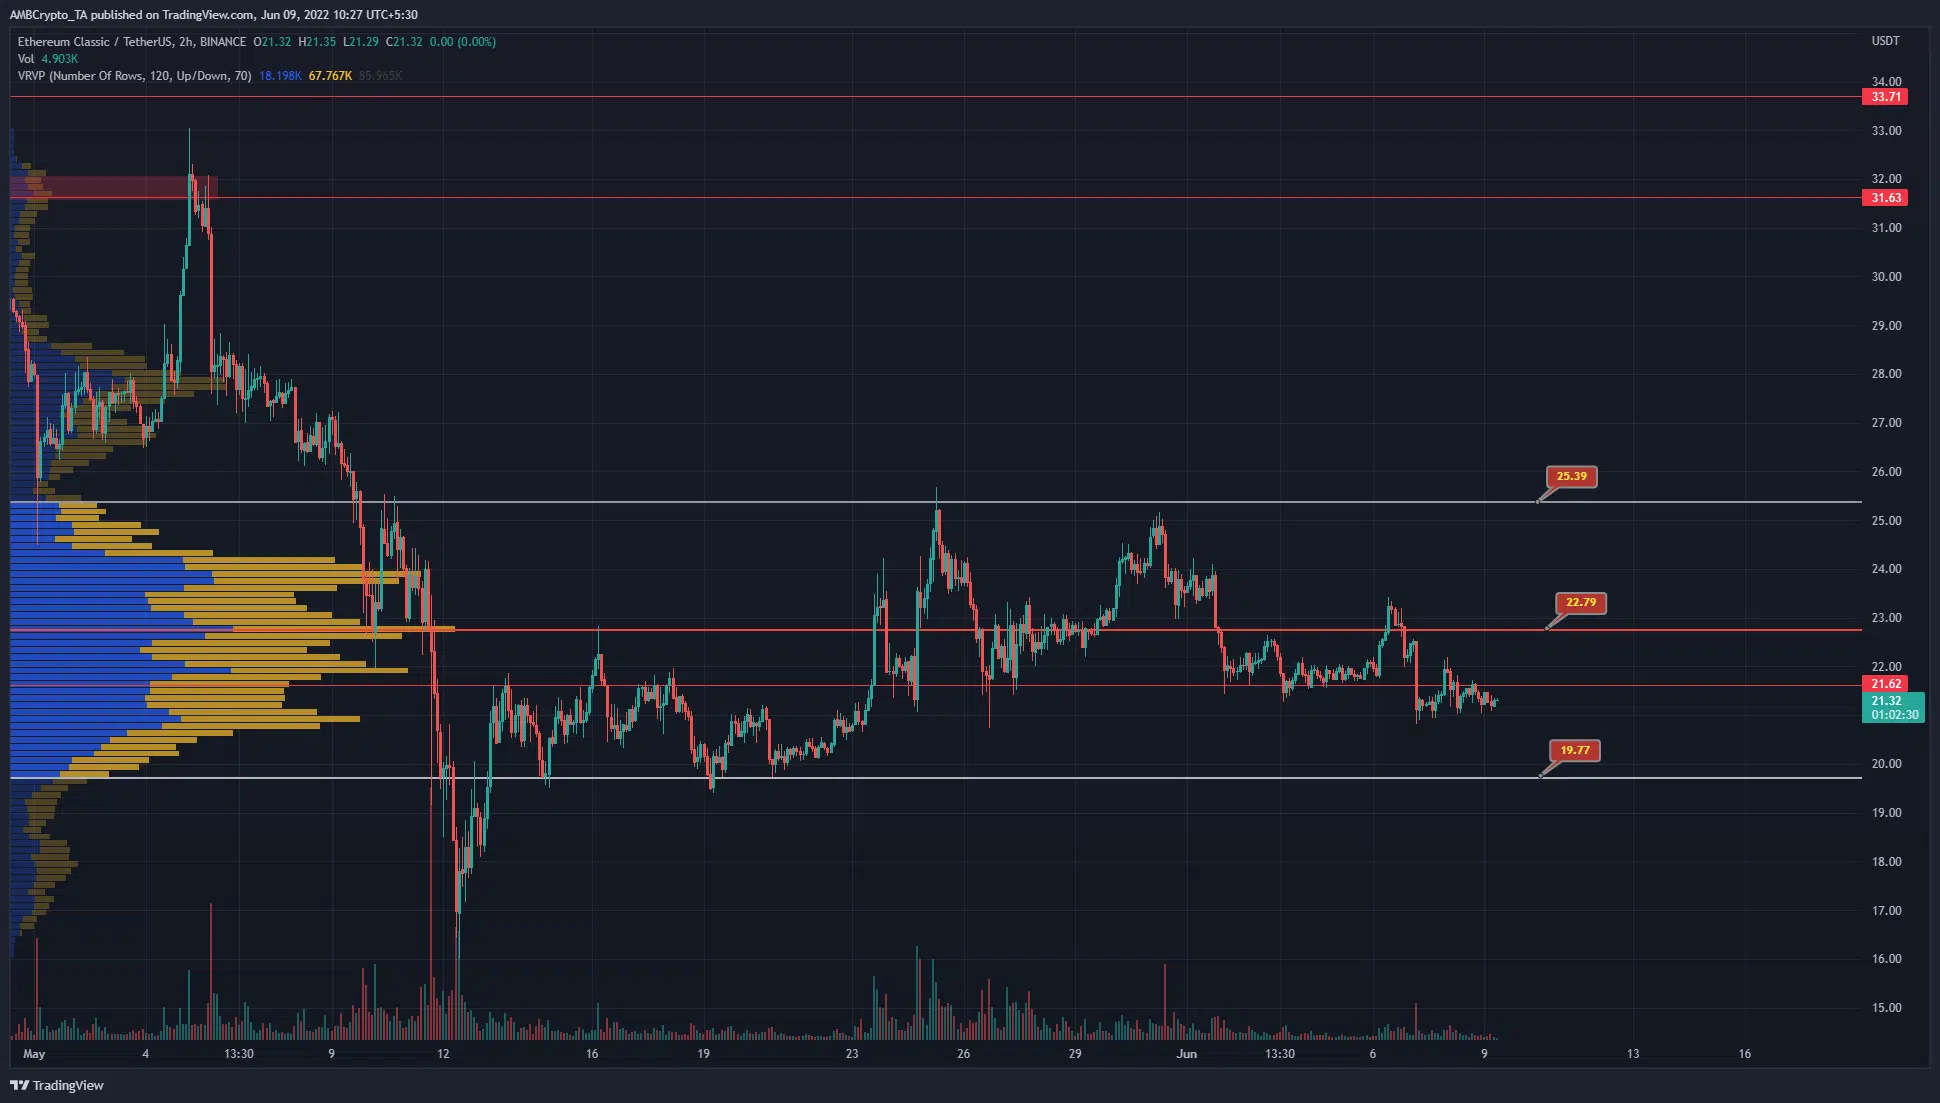
The Volume Profile Visible Range from the start of May to the current trading session showed the Point of Control to be at $22.79. The Value Area Lows and Highs lie at $19.77 and $25.39 respectively.
It can be seen that the price has traded within this range since the bounce on May 13. At the same time, another level of short-term significance lies at $21.62, and it was flipped from support to resistance in the past couple of days.
Therefore, the short-term bias is bearish, and a move toward the $20 mark could be likely in the coming days.
Rationale
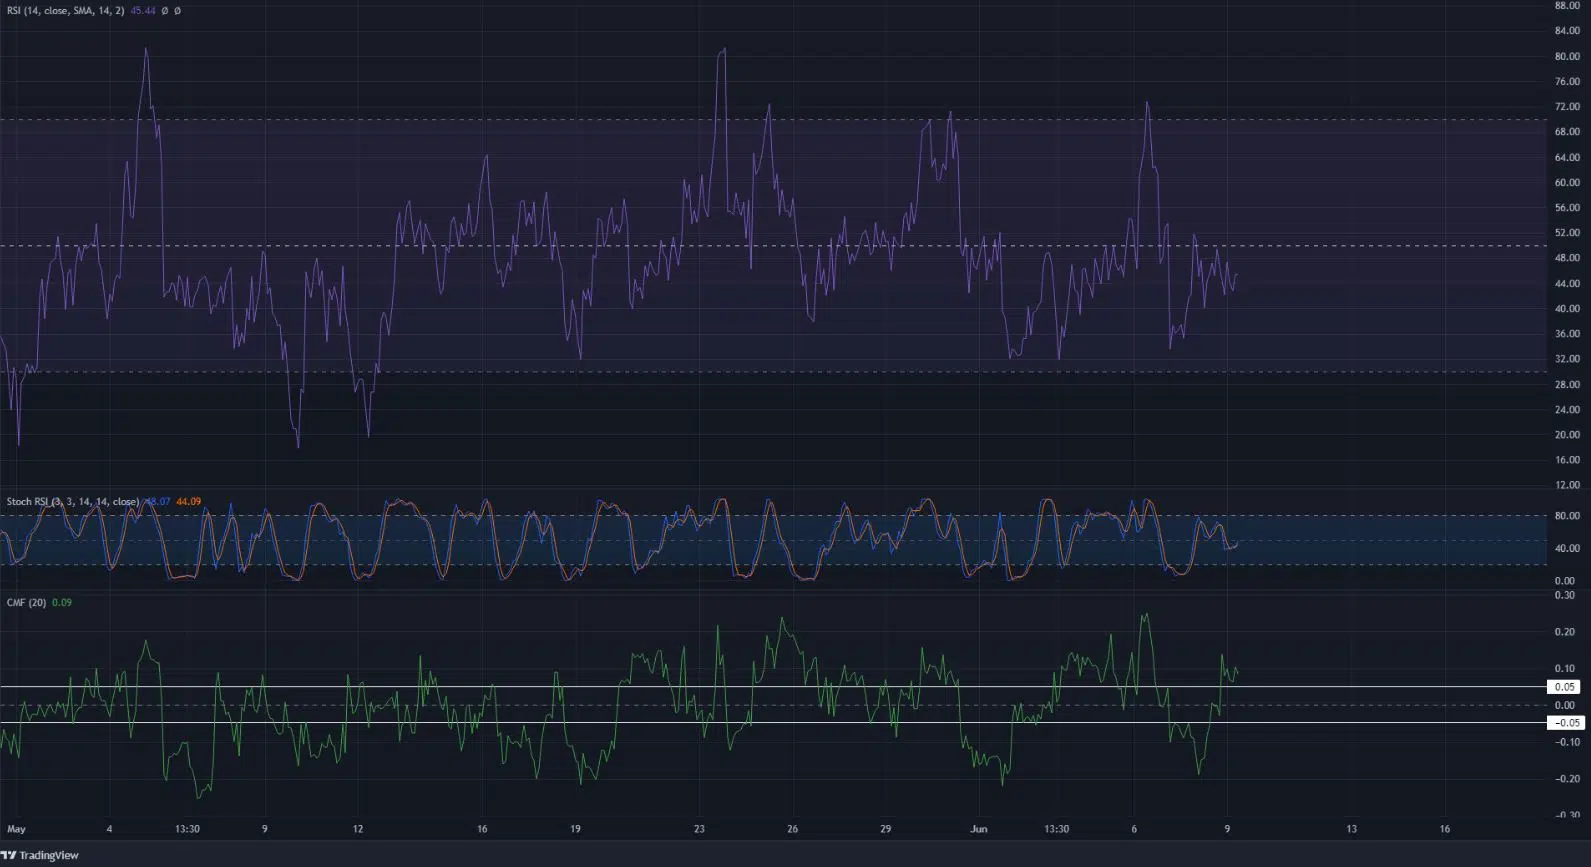
The RSI on the H2 chart has been beneath neutral 50 for most of June, except for one surge to the 72 mark. This happened when ETC climbed to $23 and above the POC, but was quickly rebuffed. The Stochastic RSI appeared to form a bullish crossover. If it reached the overbought zone and forms a bearish crossover in the coming hours, alongside a retest of neutral 50 on the RSI, it could be an early signal of a southward move.
The CMF was at +0.09 at the time of writing and has been above +0.05 for a few days in the past week. Hence, the indicator showed that buying pressure and capital flow was in favor of the bulls.
Conclusion
Despite the CMF’s findings, it was likely that ETC would retest the $21.6-$22 area as resistance and move toward $20 over the next couple of days. The momentum was with the bears, and the short-term market structure was also bearish after ETC crashed straight past the $21.6 support level two days ago.


