Ethereum Classic: Gauging ETC’s potential to reclaim a spot above $15

Ethereum Classic [ETC] saw incremental gains after rebounding from its 15-month support near the $12-mark. But the three-month trendline resistance (yellow, dashed) has kept the buying efforts under a leash.
ETC’s jumped above its EMA ribbons post the recent bullish resurgence. Meanwhile, the sellers chalked out a bearish pattern in the four-hour timeframe.
A reversal from the 23.6% Fibonacci resistance could pull ETC toward the $14-zone before a highly volatile break from its current pattern. At press time, the alt traded at $15.26.
ETC 4-hour Chart
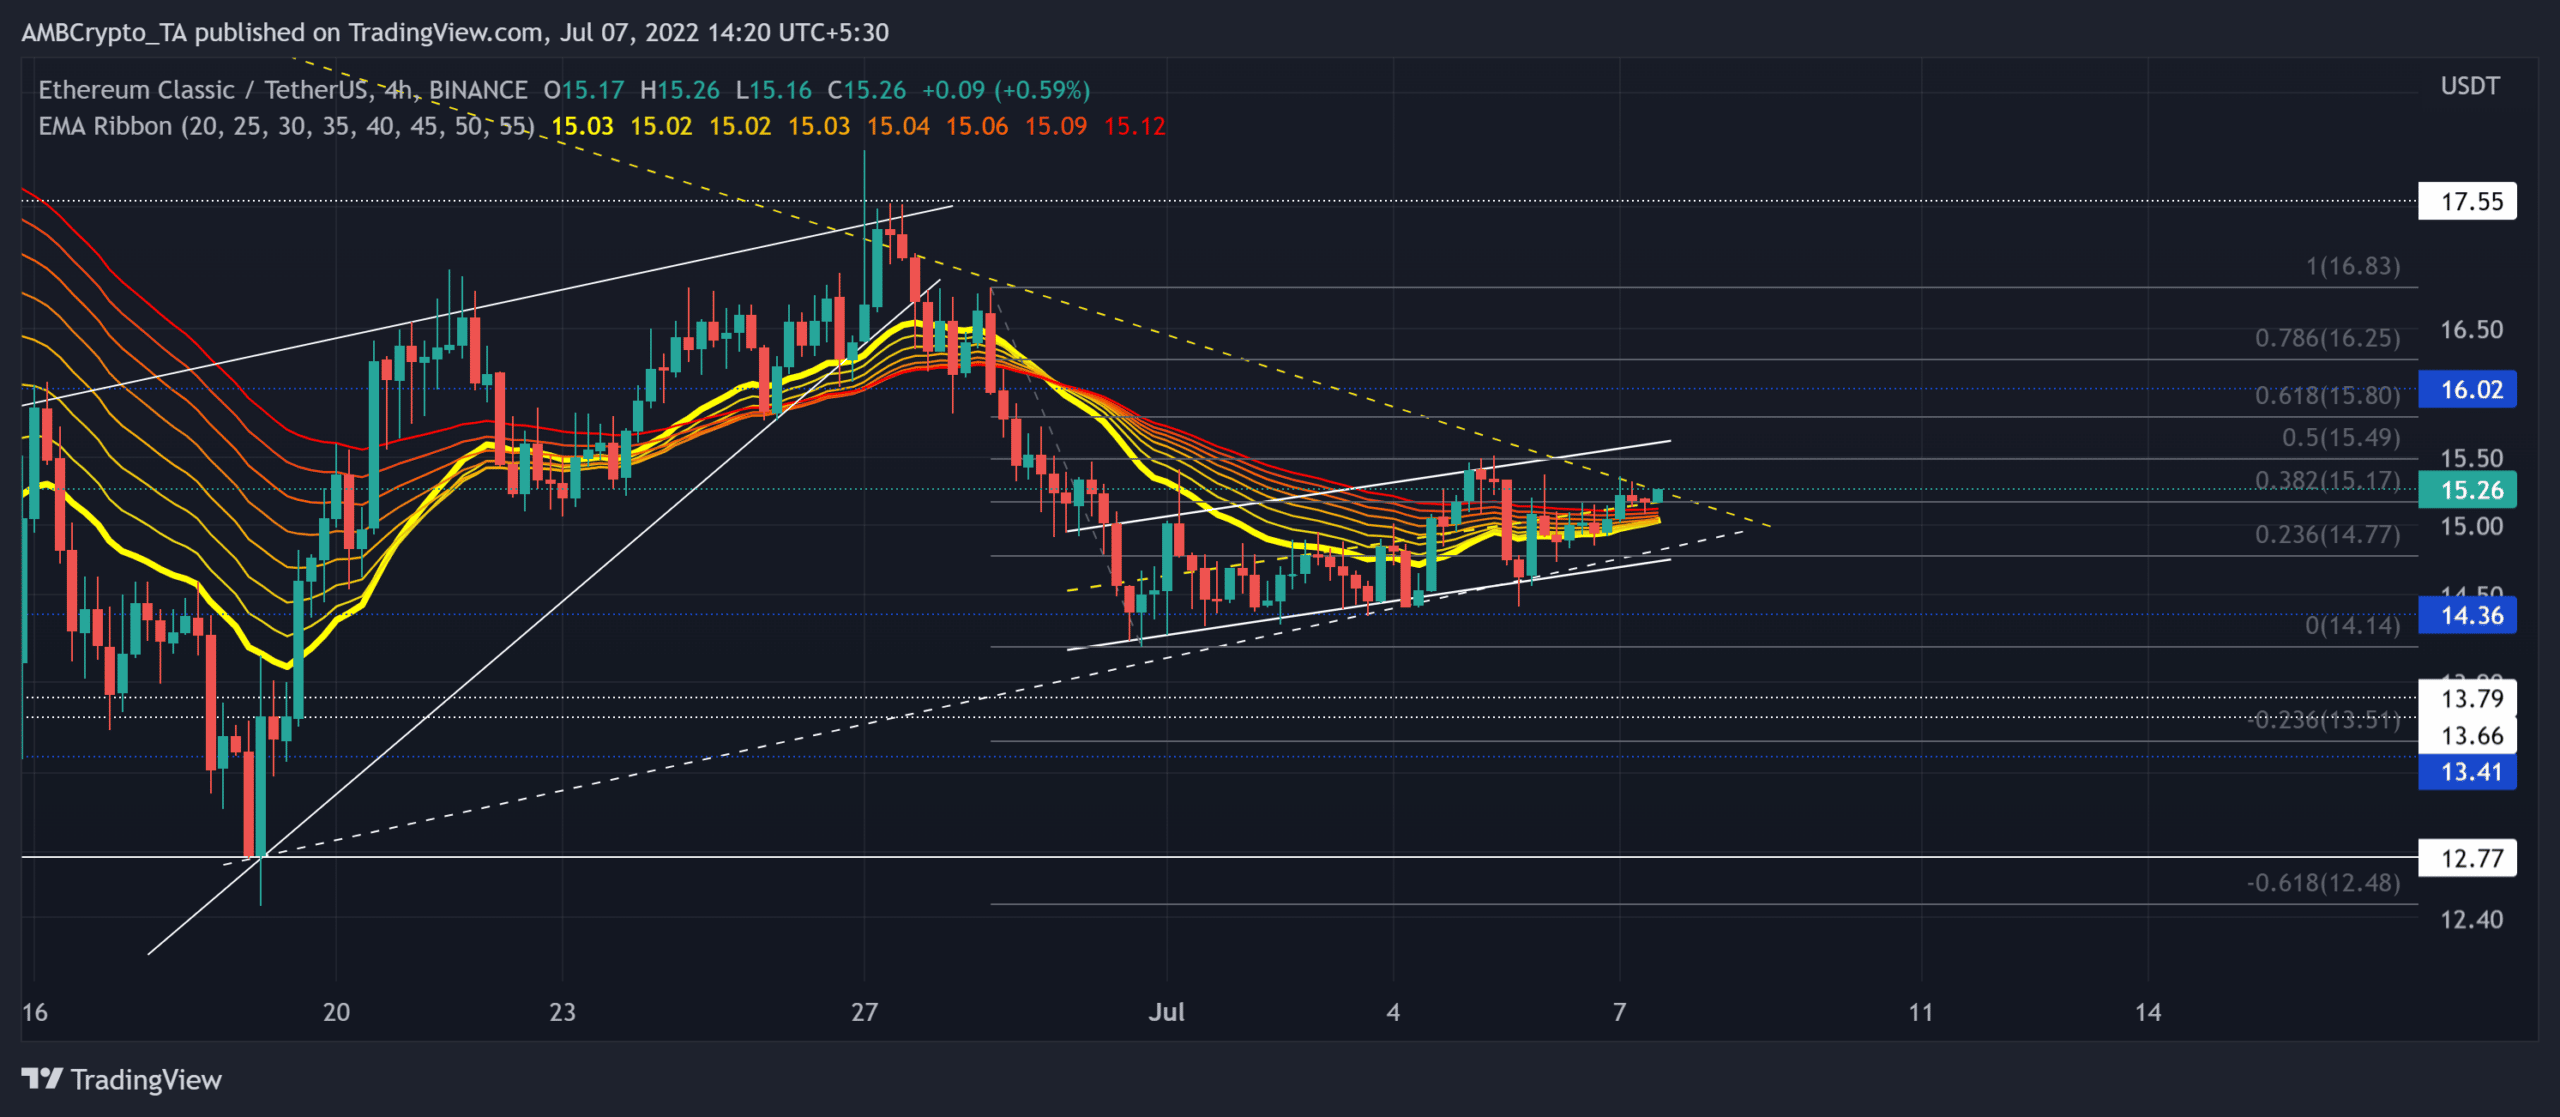
ETC’s plunge from its April highs put the alt on an extended bearish track as it registered lower peaks and troughs on a longer timeframe. During this phase, ETC saw a three-month trendline resistance. This trendline has served as an important area during the decline phase.
The 76.28% retracement (from 29 March) led the alt to poke its 15-month low on 19 June. The eventual buying comeback helped the bulls find a close above the EMA ribbons.
The last few days marked a low volatility phase while the price hovered in a bearish flag-like pattern near the 23.6% level. Also, the three-month trendline resistance coincided with the 23.6% level to create a confluence of barriers.
Should the current candlestick close below the 23.6% level, ETC would see a likely patterned oscillation. Post this, the sellers would aim to inflict a breakdown. If the buyers dwindle, any close below the pattern would expose the alt to a potential 7% downside. The shorting targets would lie in the $13-zone.
But any broader improvements in the sentiment could invalidate the bearish tendencies. A close above the trendline resistance can delay the retracement and see a likely reversal from the $15-zone.
Rationale

The Relative Strength Index (RSI) saw steady growth from above the midline. Should the midline support stand sturdy, the bulls could have a window to step in and continue a gradual revival on the chart.
Also, the Accumulation/Distribution (A/D) line marked lower troughs while affirming a mild bullish divergence with price. However, the alt revealed a substantially weak directional trend [ADX] over the last few days.
Conclusion
Should ETC find a retracing opportunity at its immediate trendline resistance, it could fall below its EMA ribbons. In this case, the take-profit levels would remain the same as above.
However, if the 20 EMA cross above the 50 EMA, the buyers would aim to invalidate the near-term bearish tendencies. Then, the traders/investors should look for a possible reversal from the $15.8-$16 range.
Finally, the broader market sentiment and the on-chain developments would play a vital role in influencing future movements.