Ethereum Classic: If you’re a trader, here’s why longing can wait

Disclaimer: The findings of the following analysis are the sole opinions of the writer and should not be taken as investment advice
A series of price barriers between $50-$56 was restricting Ethereum Classic from playing catch up in the market. As buyers contest sellers on prickly ground, expect ETC to tread lightly within an up-channel going forward.
A close above $57-58.3 could generate some more bullish momentum. However, ETC needs to slice above $65 in order to be in cruise control. At the time of writing, ETC was trading at $54.8, up by 3.6% over the last 24 hours.
Ethereum Classic 4-hour Chart
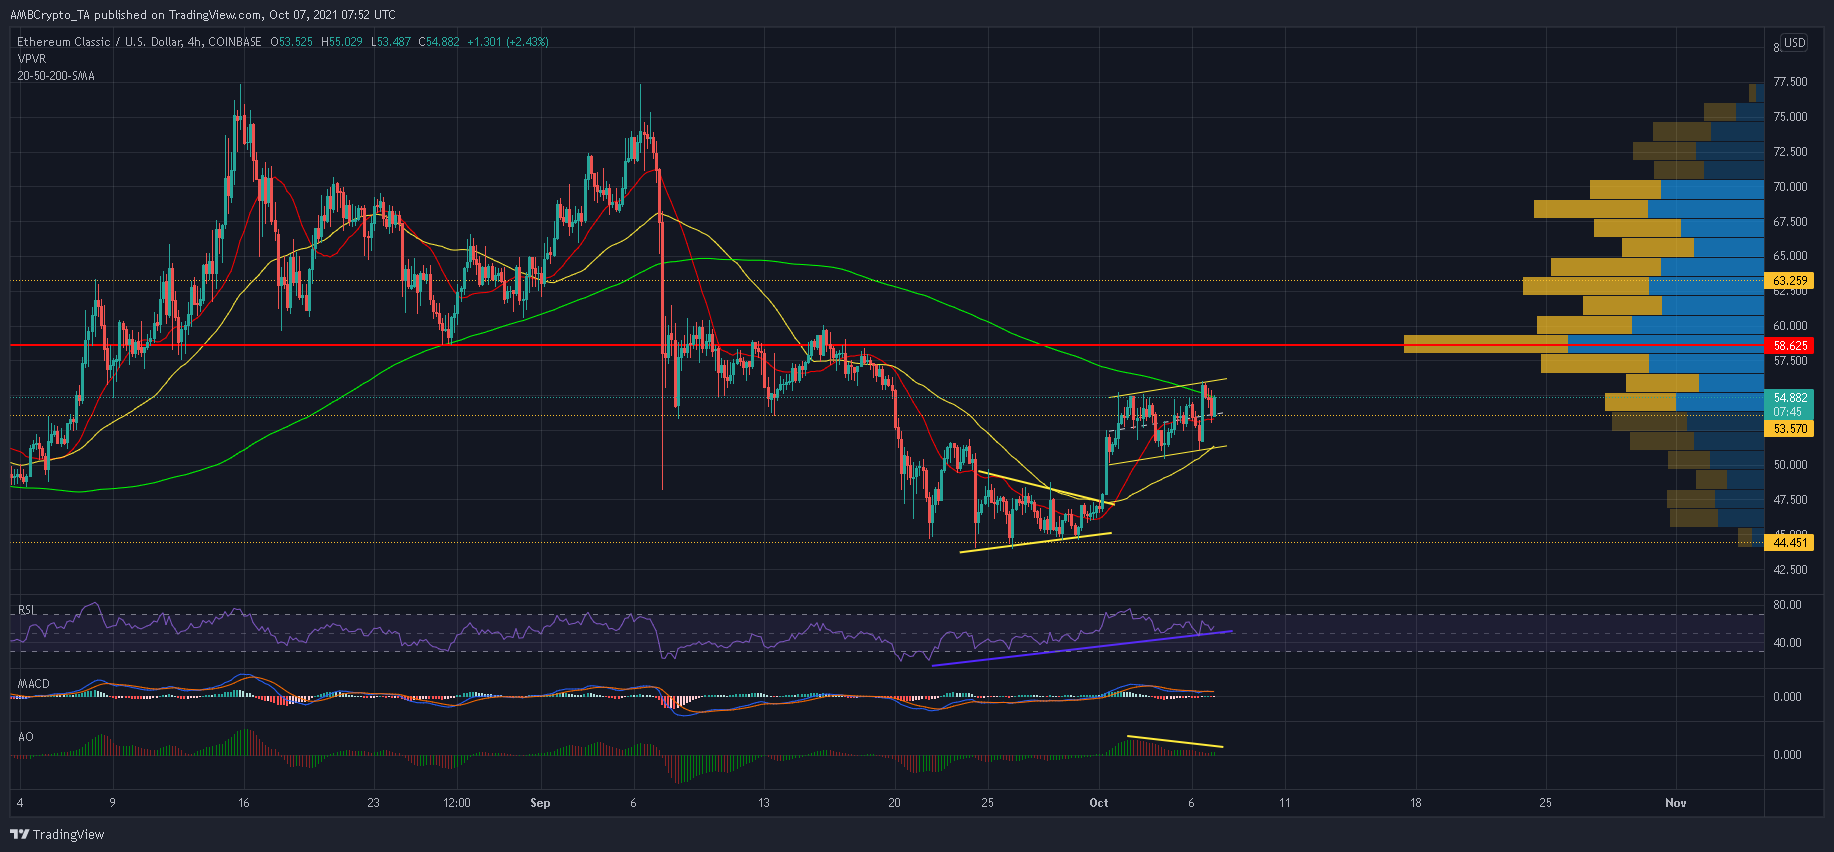
Consecutive higher highs at $54.6, $55 and $56, in conjunction with higher lows at $50.1, $50.4 and $51, outlined an up-channel on ETC’s 4-hour chart. After retracing from its latest high, the mid-point of the pattern allowed an early rebound. however, bulls had to contest the 4-hour 200-SMA (green) for another assault at the upper trendline.
A close above $55.2 would make it easier for bulls to enforce a breakout from the pattern and target some rigid price barriers.
Meanwhile, sellers can look for an early cut-off between $57-$58.3 and even at $60.5. However, a move above these levels could push ETC towards $69 before any kind of bearish response.
Reasoning
Now, the Relative Strength Index rebounded from the mid-line and maintained itself within the bullish territory. This was an indication of strength and confirmation of sorts that ETC was still within an uptrend. However, the MACD was intertwined with the Signal line and failed to highlight a clear trend.
Nevertheless, this reading can be expected to keep sellers at bay since the index traded above its equilibrium mark. On the other hand, the Awesome Oscillator disagreed with favorable predictions after registering a bearish twin peak.
Based on this setup, ETC seemed to shed value and form a new low at its bottom trendline.
Conclusion
Even though there were some near-term concerns, a close above the 200-SMA would alleviate many uncertainties. An upwards breakout from the pattern could even translate to a 13% run-up, provided a few price barriers are successfully overturned.
However, a safer bet for traders would be to wait for a breakout confirmation before taking up any long positions.