
Disclaimer: The findings of the following analysis are the sole opinions of the writer and should not be taken as investment advice
Although Ethereum Classic has maintained a positive ROI of 6% in October so far, a host of altcoins have managed to outperform the world’s 29th largest cryptocurrency. On the chart, ETC’s price action has been largely due to a double top and a series of flash crashes in September.
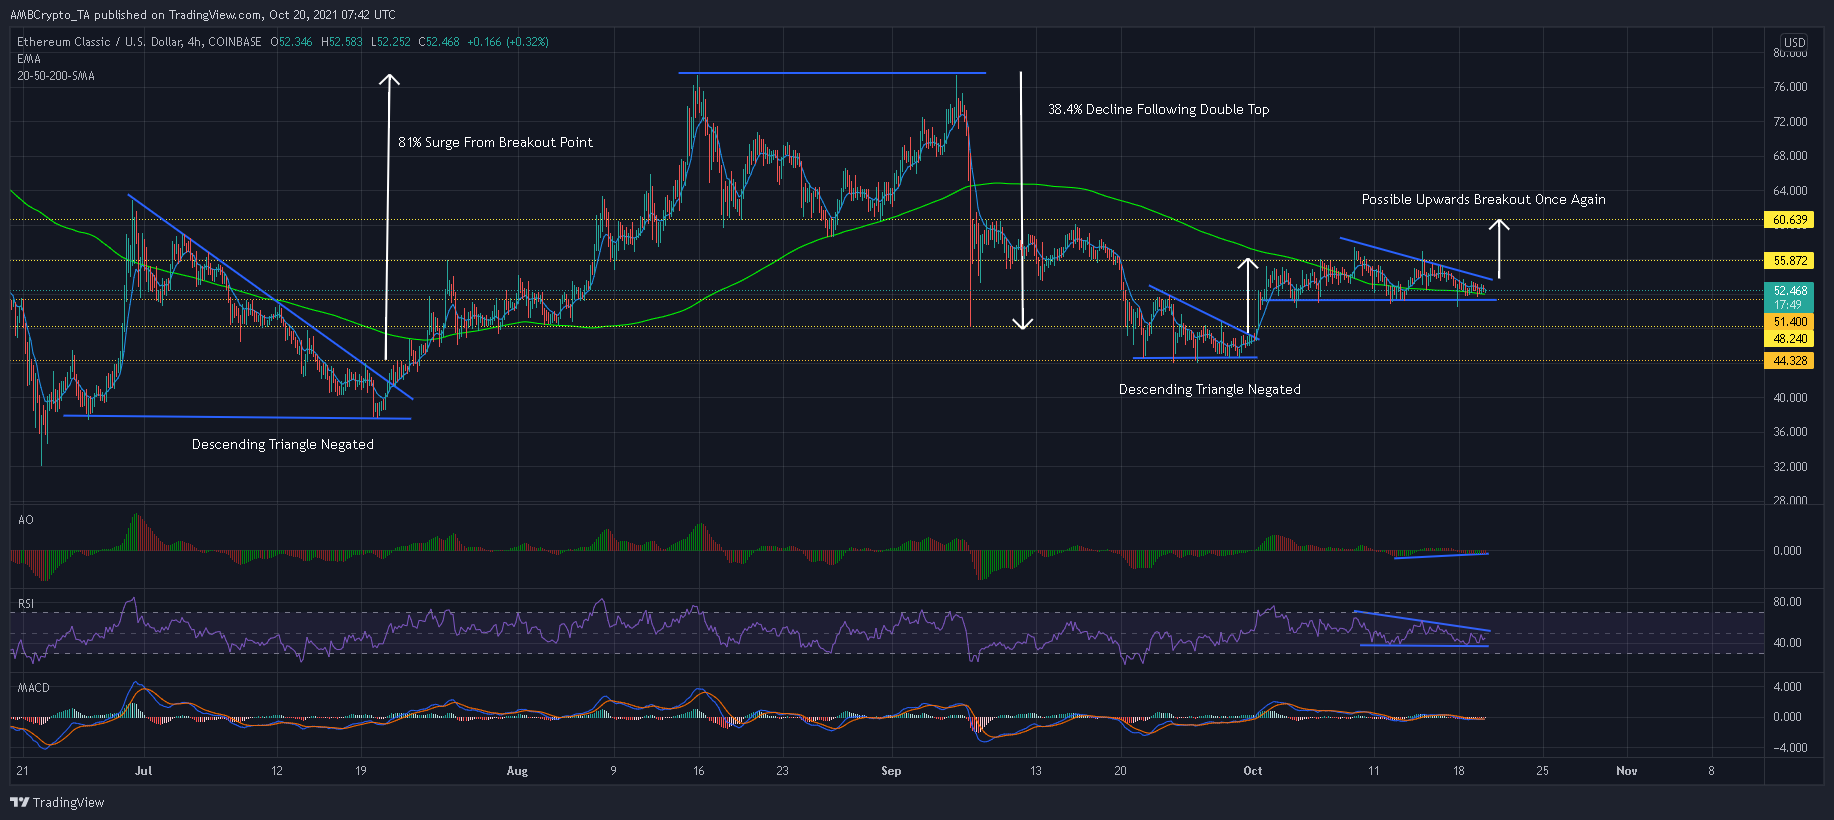
Despite a slight recovery during the first week of October, an impeding descending triangle tainted ETC’s near-term outlook. At the time of writing, the crypto was traded at $52.4, down by 0.9% over the last 24 hours.
Ethereum Classic 4-hour Chart
Source: ETC/USD, TradingView
Steady lows around $51.4 combined with lower highs over the past week, indicating a descending triangle setup on ETC’s 4-hour timeframe. At the time of writing, the 200-SMA (green) was delaying a fifth attack on the bottom trendline but expect this base to be tested once again if bears negotiate past the long-term moving average line.
Should bulls fail to contain sell pressure above $51.4, ETC would be at the risk of a breakdown from the pattern and a possible 13.5% depreciation in value. Buyers can hit back at near-term support levels of $48.2 and $44.3.
Interestingly, it’s worth mentioning that ETC has negated the last 2 descending triangle setups – One in mid-July and the other in late September. In fact, the alt has commenced on an upwards run on both occasions as bulls formulated a breakout of their own.
If a similar development were to occur based on these findings, ETC would eye a northbound move from the pattern. According to the highs and lows within the setup, ETC targeted an 11% jump from the breakout point. Moreover, a close above $60.6 on strong volumes would allow bulls to hunt more aggressively for additional price levels.
Reasoning
Market observers should keep a close eye on ETC’s RSI for more clarity in terms of a breakout. The RSI, which also traded within a descending triangle, would side with a bearish outcome in case it weakens below the 35-support.
Conversely, bulls would hope to maintain the RSI within the pattern and target a peak above 50-55. Meanwhile, the MACD remained bearish-neutral while a slight bullish divergence was observed on the Awesome Oscillator.
Conclusion
ETC was almost split evenly between a bullish and a bearish outcome. If bears can initiate a close below $51.4 or if the RSI declines below 35, ETC would be exposed to a 13.5% drawdown.
On the other hand, bulls will look to defend against another attack at the baseline – A development that could force a move in their favor.