Ethereum Classic targets an 85% ascent following symmetrical triangle breakout

Ethereum Classic has toppled the upper trendline of its symmetrical, thereby setting a possible 85% surge in motion. A daily close above the 200-SMA (green) would help confirm an extended rally all the way towards the 50% Fibonacci level at $103.6.
From there, an overbought RSI could trigger a minor correction before ETC commences forward towards its May local high. At the time of writing, ETC traded at xx
Ethereum Classic Daily Chart
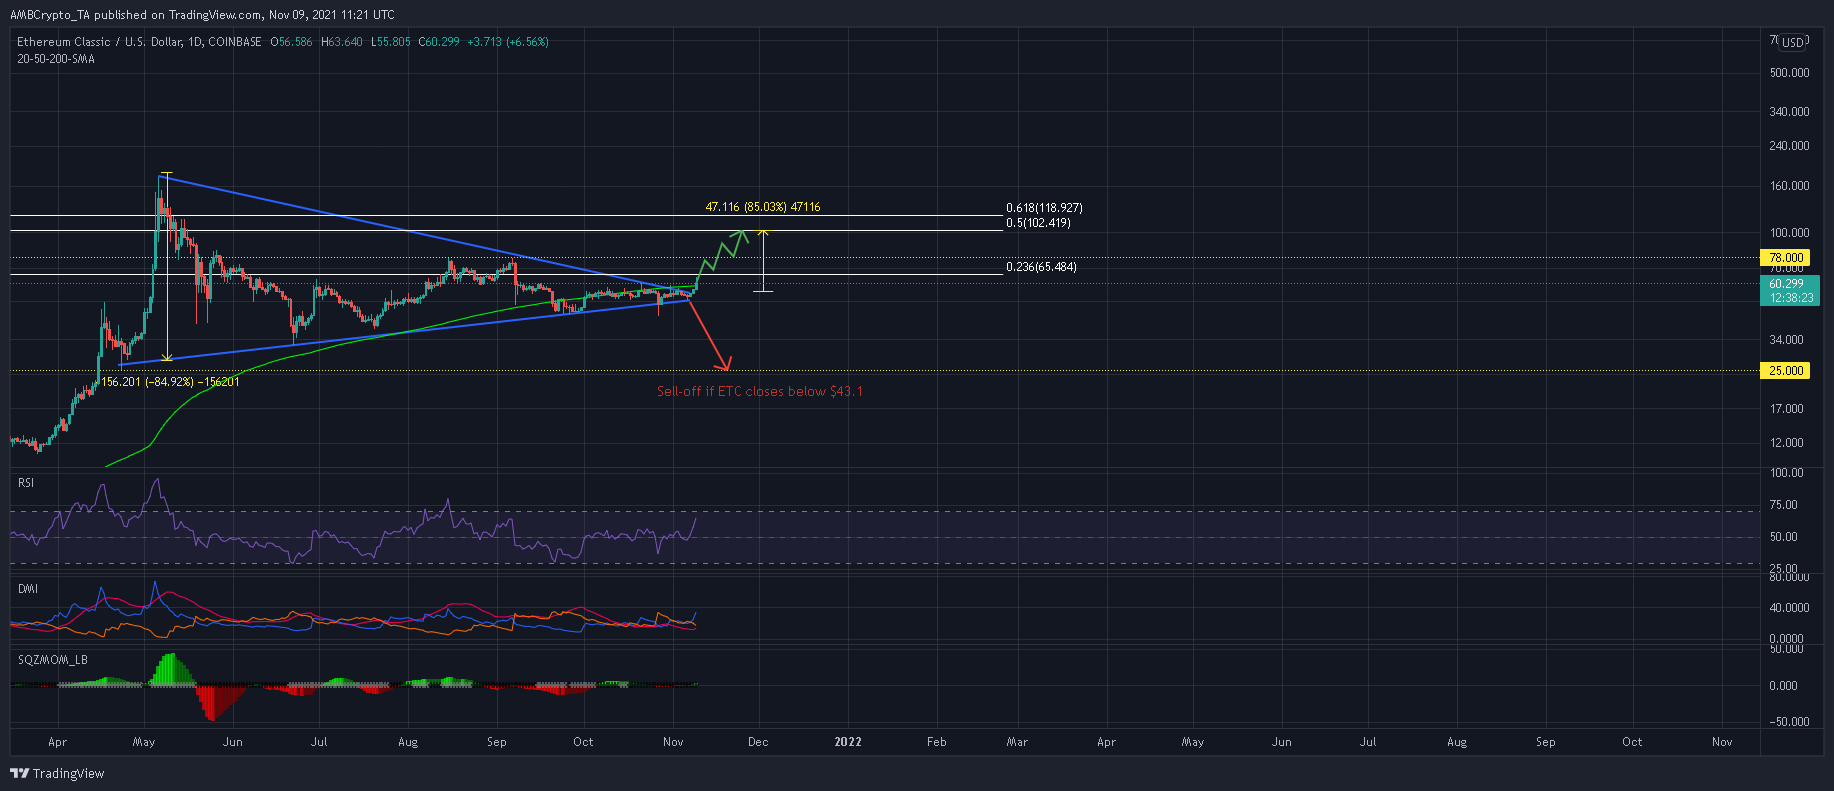
Ethereum Classic’s symmetrical triangle has formed for nearly 5 months now following its explosive start to 2021 and a 1,550% percentage increase between late-March to early May. Based on the highest and lowest peak within the pattern, ETC eyed a 85% surge from the breakout point. Now that ETC has registered two green candles above the upper trendline, the next step was to overturn the 200-SMA (green) to bullish in order to kickstart the ascent.
Should ETC close above this long term moving average line convincingly, the 50% Fibonacci level at $103.6 would be its next destination after successfully negotiating past some sell pressure at $78.08.
To enforce a breakdown, bears would need to target a close below 27 October’s low of $43.1. In this outcome, ETC would be exposed to a massive sell-off towards late-April levels of $25. However, this was rather unlikely should the broader market continue to remain risk-on.
Reasoning
ETC’s upside potential was backed by a bullish RSI which traded above 65. Over the near-term, ETC could even extend gains above the 23.6% Fibonacci level before an overbought RSI triggers a minor correction. The Directional Movement Index flashed a buy signal following a bullish crossover between the +DI and -DI lines.
Meanwhile, the Squeeze Momentum Indicator was yet to show a clear direction and maintained a neutral-bias. However, expect this to change once a ‘squeeze release’ it witnessed and volatility picks up in the market.
Conclusion
ETC targeted an 85% upswing following a symmetrical triangle breakout. The RSI and DMI lent credence to a bullish prediction. Once ETC closes above its 200-SMA (green), ETC could make headway towards it target at the 50% Fibonacci level after battling past sell pressure at $78.


