Ethereum Classic: The next 48 hours may be crucial for traders looking to buy/sell

Disclaimer: The findings of the following analysis are the sole opinions of the writer and should not be considered investment advice.
Within the span of two weeks, Ethereum Classic [ETH] witnessed six moves on the price charts that measured more than 10% in magnitude. Most of these happened in short bursts, within the span of a day.
With such volatile conditions raging, lower timeframe momentum traders could have had some enormous gains. While volatility is a scalper’s paradise, positional traders could struggle in getting a read on the market.
ETC- 1-Hour Chart
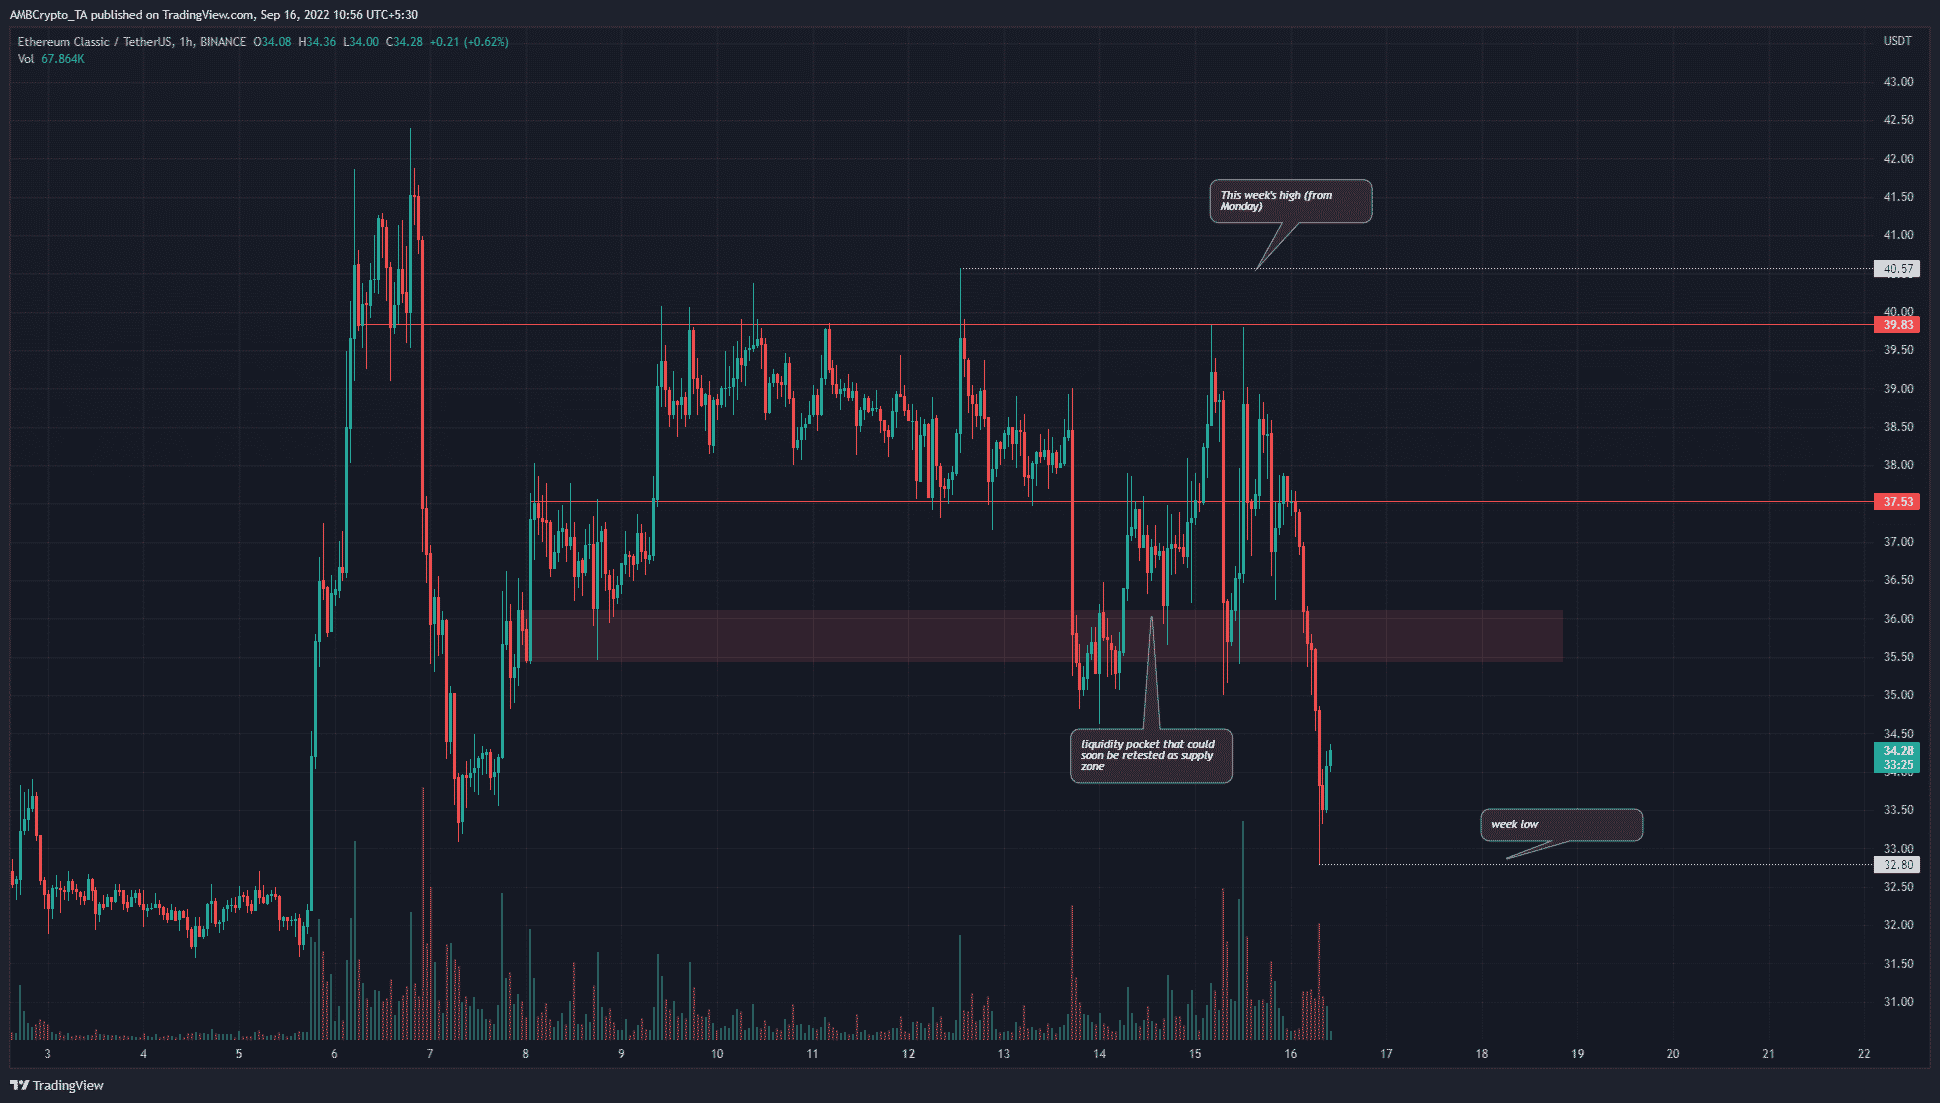
The past week’s high and low was marked in white. Two important short-term resistance levels at $39.8 and $37.5 were also highlighted. These resistance levels have seen a noticeable reaction from the price and meant that they are levels to watch out for, should ETC manage to climb higher.
At the time of writing, it traded in the $33 region, which was a resistance zone in early September but was flipped to support last week. Similarly, the $35 region marked by the red box has been a bearish order block in the recent past. It saw a good bounce from ETC a couple of days ago, but since then the buyers have been exhausted. This was evidenced by the price crashing right through the support belt the previous day.
Over the next day or two, the $36 region and the $37.5 level could offer selling opportunities. A retest of the $36 area could also offer a buying opportunity targeting $37.5 and $39.8.
Rationale
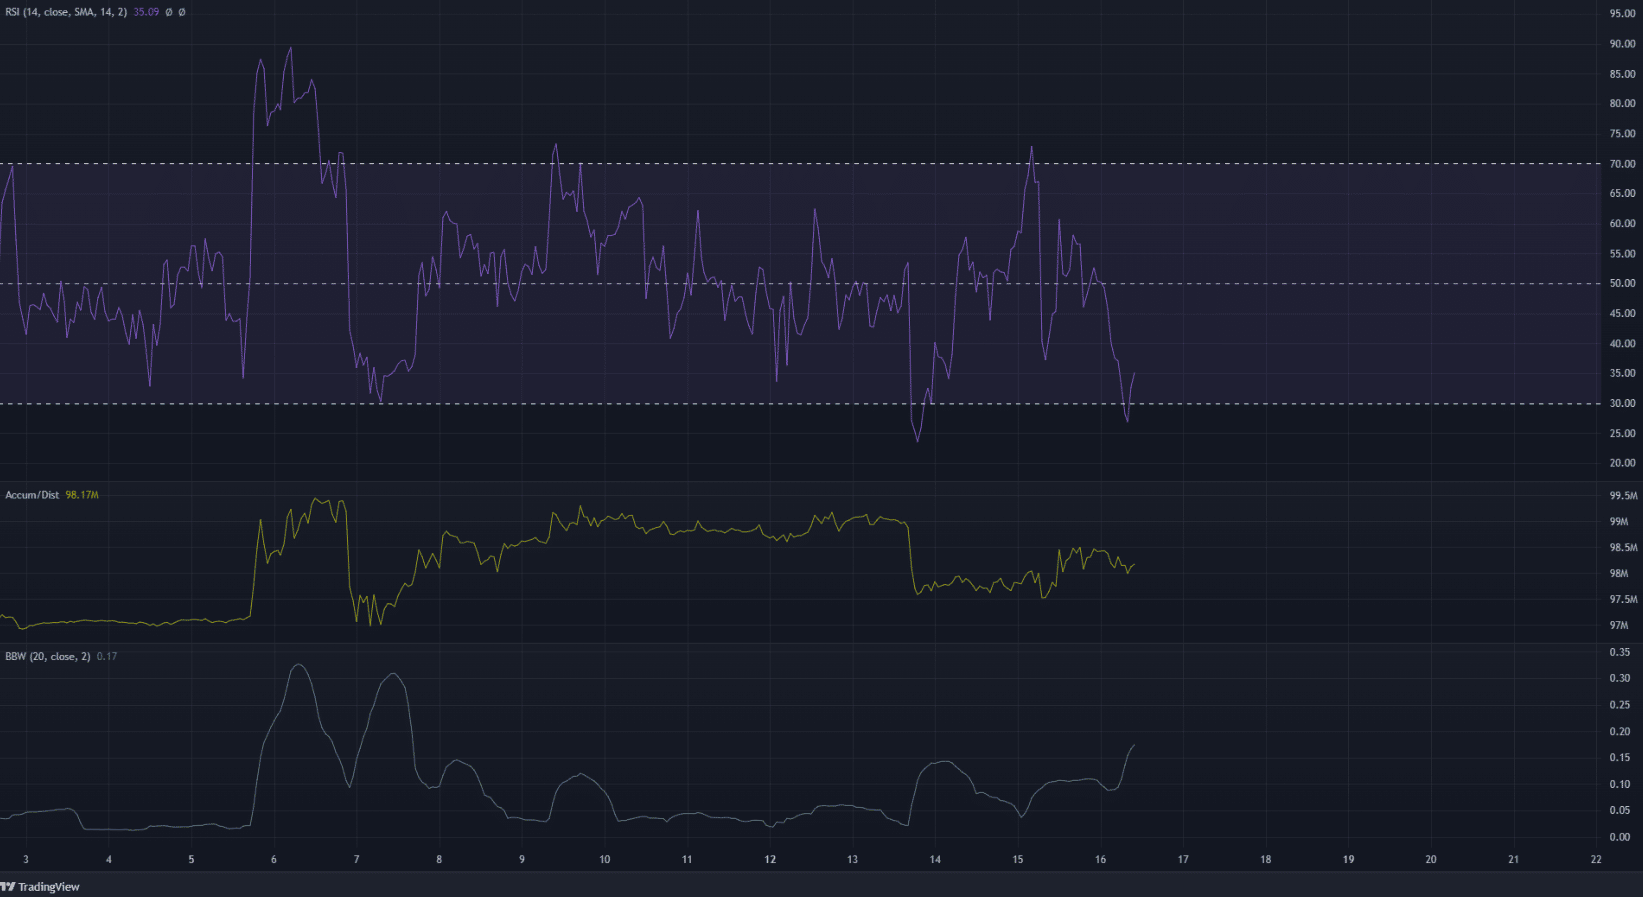
The Relative Strength Index (RSI) fell rapidly below the neutral 50 line to outline to strong bearish momentum in recent hours. Another observation was that, for the better part of last week, the RSI has been below neutral 50. This meant that the momentum has been neutral or leant bearish, with sudden violent moves that saw the RSI reach the extreme values.
The Accumulation/Distribution (A/D) has been relatively flat as well. The large spike it had a week ago saw a sell-off earlier this week. The buying and selling volume have somewhat balanced each other and a strong trend in terms of demand or supply was not yet seen on lower timeframes.
The Bollinger Bands (BB) width indicator shot higher in recent days to showcase the rising volatility.
Conclusion
Some important supply and demand zones were highlighted on the charts. Flipping the $36 region back to support could pave the way for a leg upward as high as $39.8. In the meantime, the momentum and bias leant bearish and buyers should be cautious.


