Ethereum Classic: Which way will triumphant bulls head next?

Disclaimer: The information presented does not constitute financial, investment, trading, or other types of advice and is solely the writer’s opinion.
- ETC rode the bullish wave with 16.5% gains over the past 48 hours.
- Rising Open Interest encouraged bulls with more gains likely.
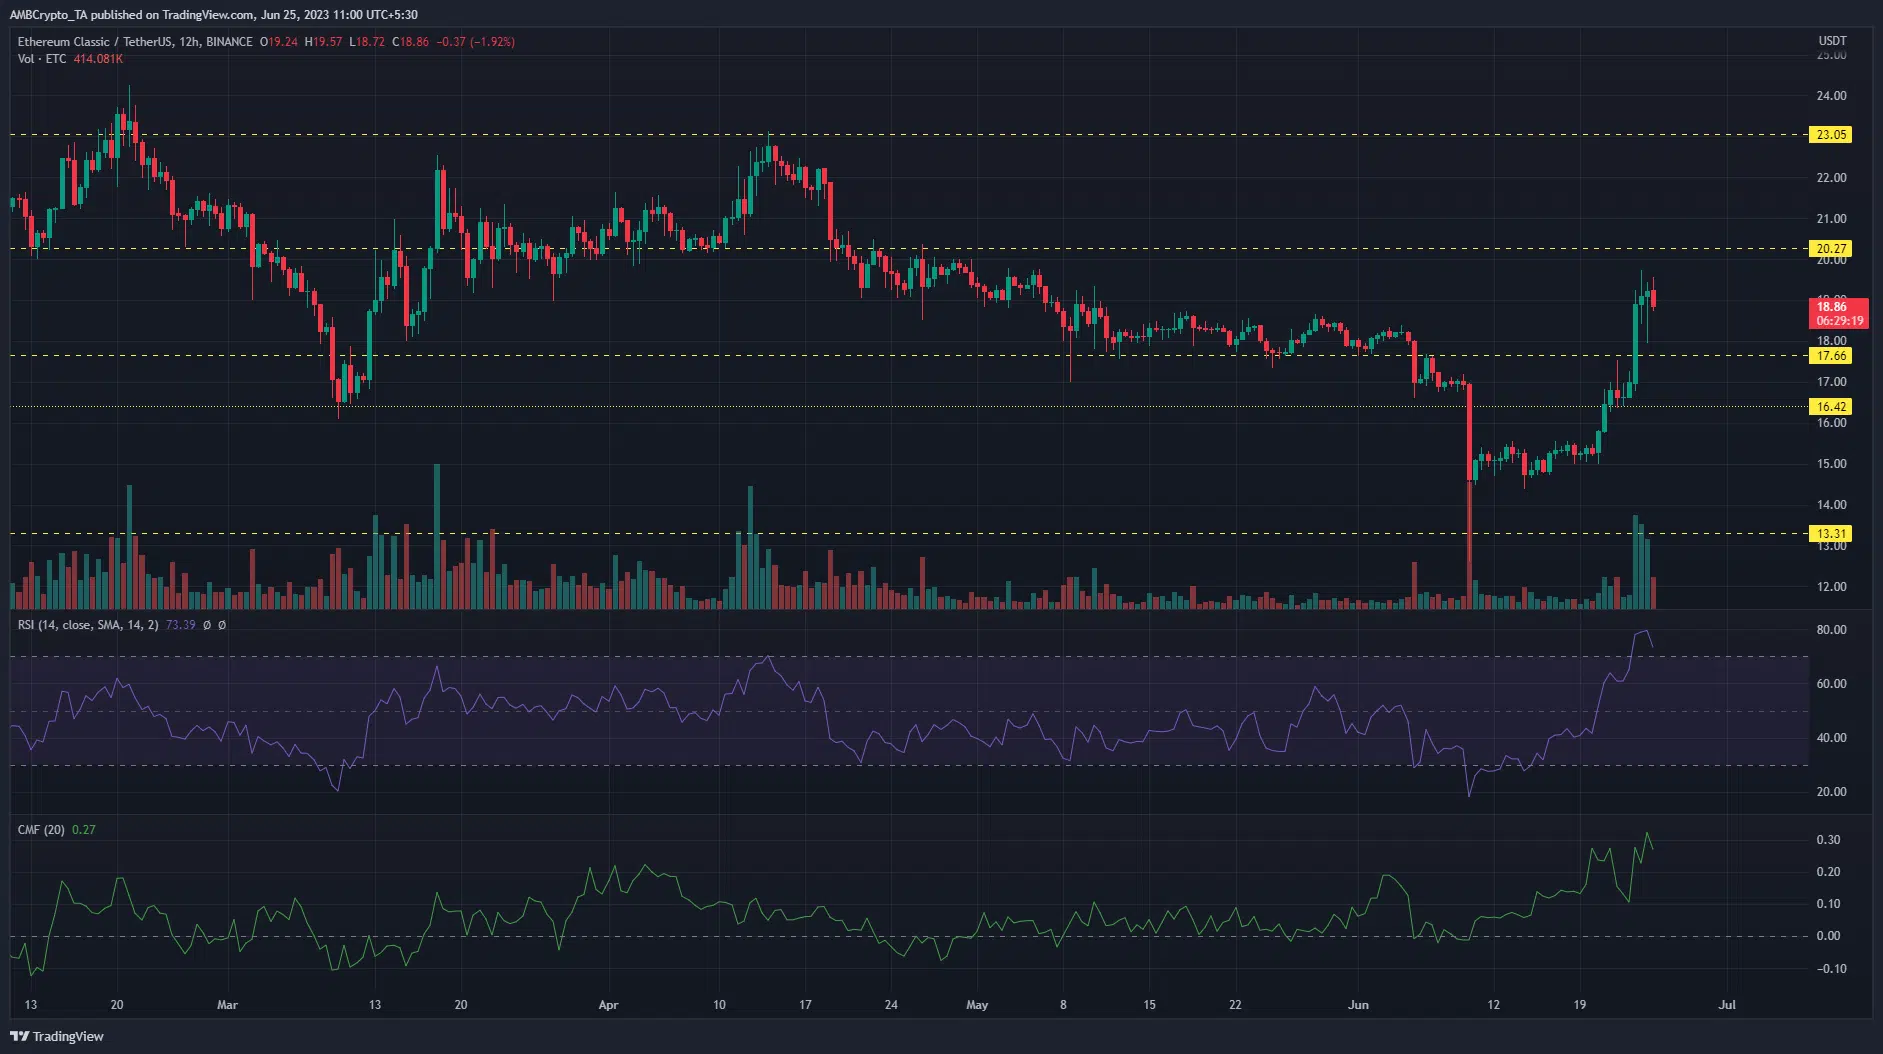
Holders of Ethereum Classic [ETC] rode the bullish market wave to record significant gains over the past 48 hours. A price bounce of 16.5% saw ETC smash the $17.66 resistance to trade at $18.84, as of press time.
Read Ethereum Classic’s [ETC] Price Prediction 2023-24
As the global crypto market cap continues to rise with Bitcoin [BTC] approaching $31k, all the signals point to an extension of Ethereum Classis’s bullish rally.
Strong inflow of trading volume initiates bullish break of sideways structure
ETC bounced off the key support level of $13.31 to steam the severe losses it had suffered from the bearish swing. The dip to $13.31 created a price imbalance, which was slowly filled as price recovered. This led Ethereum Classic to trade sideways between 10 June to 20 June.
An increase in the daily trading volume had been highlighted in this previous price report as the key to a significant bullish breakout. A slight uptick in volume on 21 June saw ETC break the minor resistance at $16.42 before a brief pullback.
However, the trading volume ramped up on 23 June with a big bullish candle on the 12-hour timeframe flipping the $17.66 from resistance to support.
Bulls firmly have the $20.27 level in sight and sustained trading volume could see this target met. Buyers can wait for a retest of the $17.66 support before riding the bullish wave to $20.27.
On the flip side, another decline in trading volume could turn over the advantage to sellers, especially at the next resistance level ($20.27).
Meanwhile, the on-chart indicators supported the continuation of the bullish rally. The Relative Strength Indicator (RSI) climbed strongly into the overbought zone with a reading of 73, as of press time.
More capital inflows into ETC delivered a positive reaction on the Chaikin Money Flow (CMF) which stood at +0.28.
Rising Open Interest indicates support for bullish push
Is your portfolio green? Check out ETC Profit Calculator
Market speculators responded to ETC’s bullish rally with a significant increase in Open Interest (OI). Data from Coinalyze showed that the OI rose by $20 million over the past 48 hours. This hinted that futures traders were actively looking to ride ETC’s bullish momentum.
Despite the bullish rally, the fluctuating Funding Rate should be closely monitored by ETC buyers to avoid being caught out by a bearish reversal.


