
- Ethereum Classic (ETC) flashed a general downtrend with decreasing price highs and lows, coupled with diminishing trading volumes
- A bearish ‘death cross’ suggested a potential long-term downtrend
Ethereum Classic (ETC) has been a staple in the cryptocurrency market, but never expected to go 100x. Still, 2024 is widely anticipated to be a very bullish year for the market, even more so than it has already been. However, things have slowed down recently, and markets have tumbled.
So, what about ETC? What’s its fate for the rest of the year?
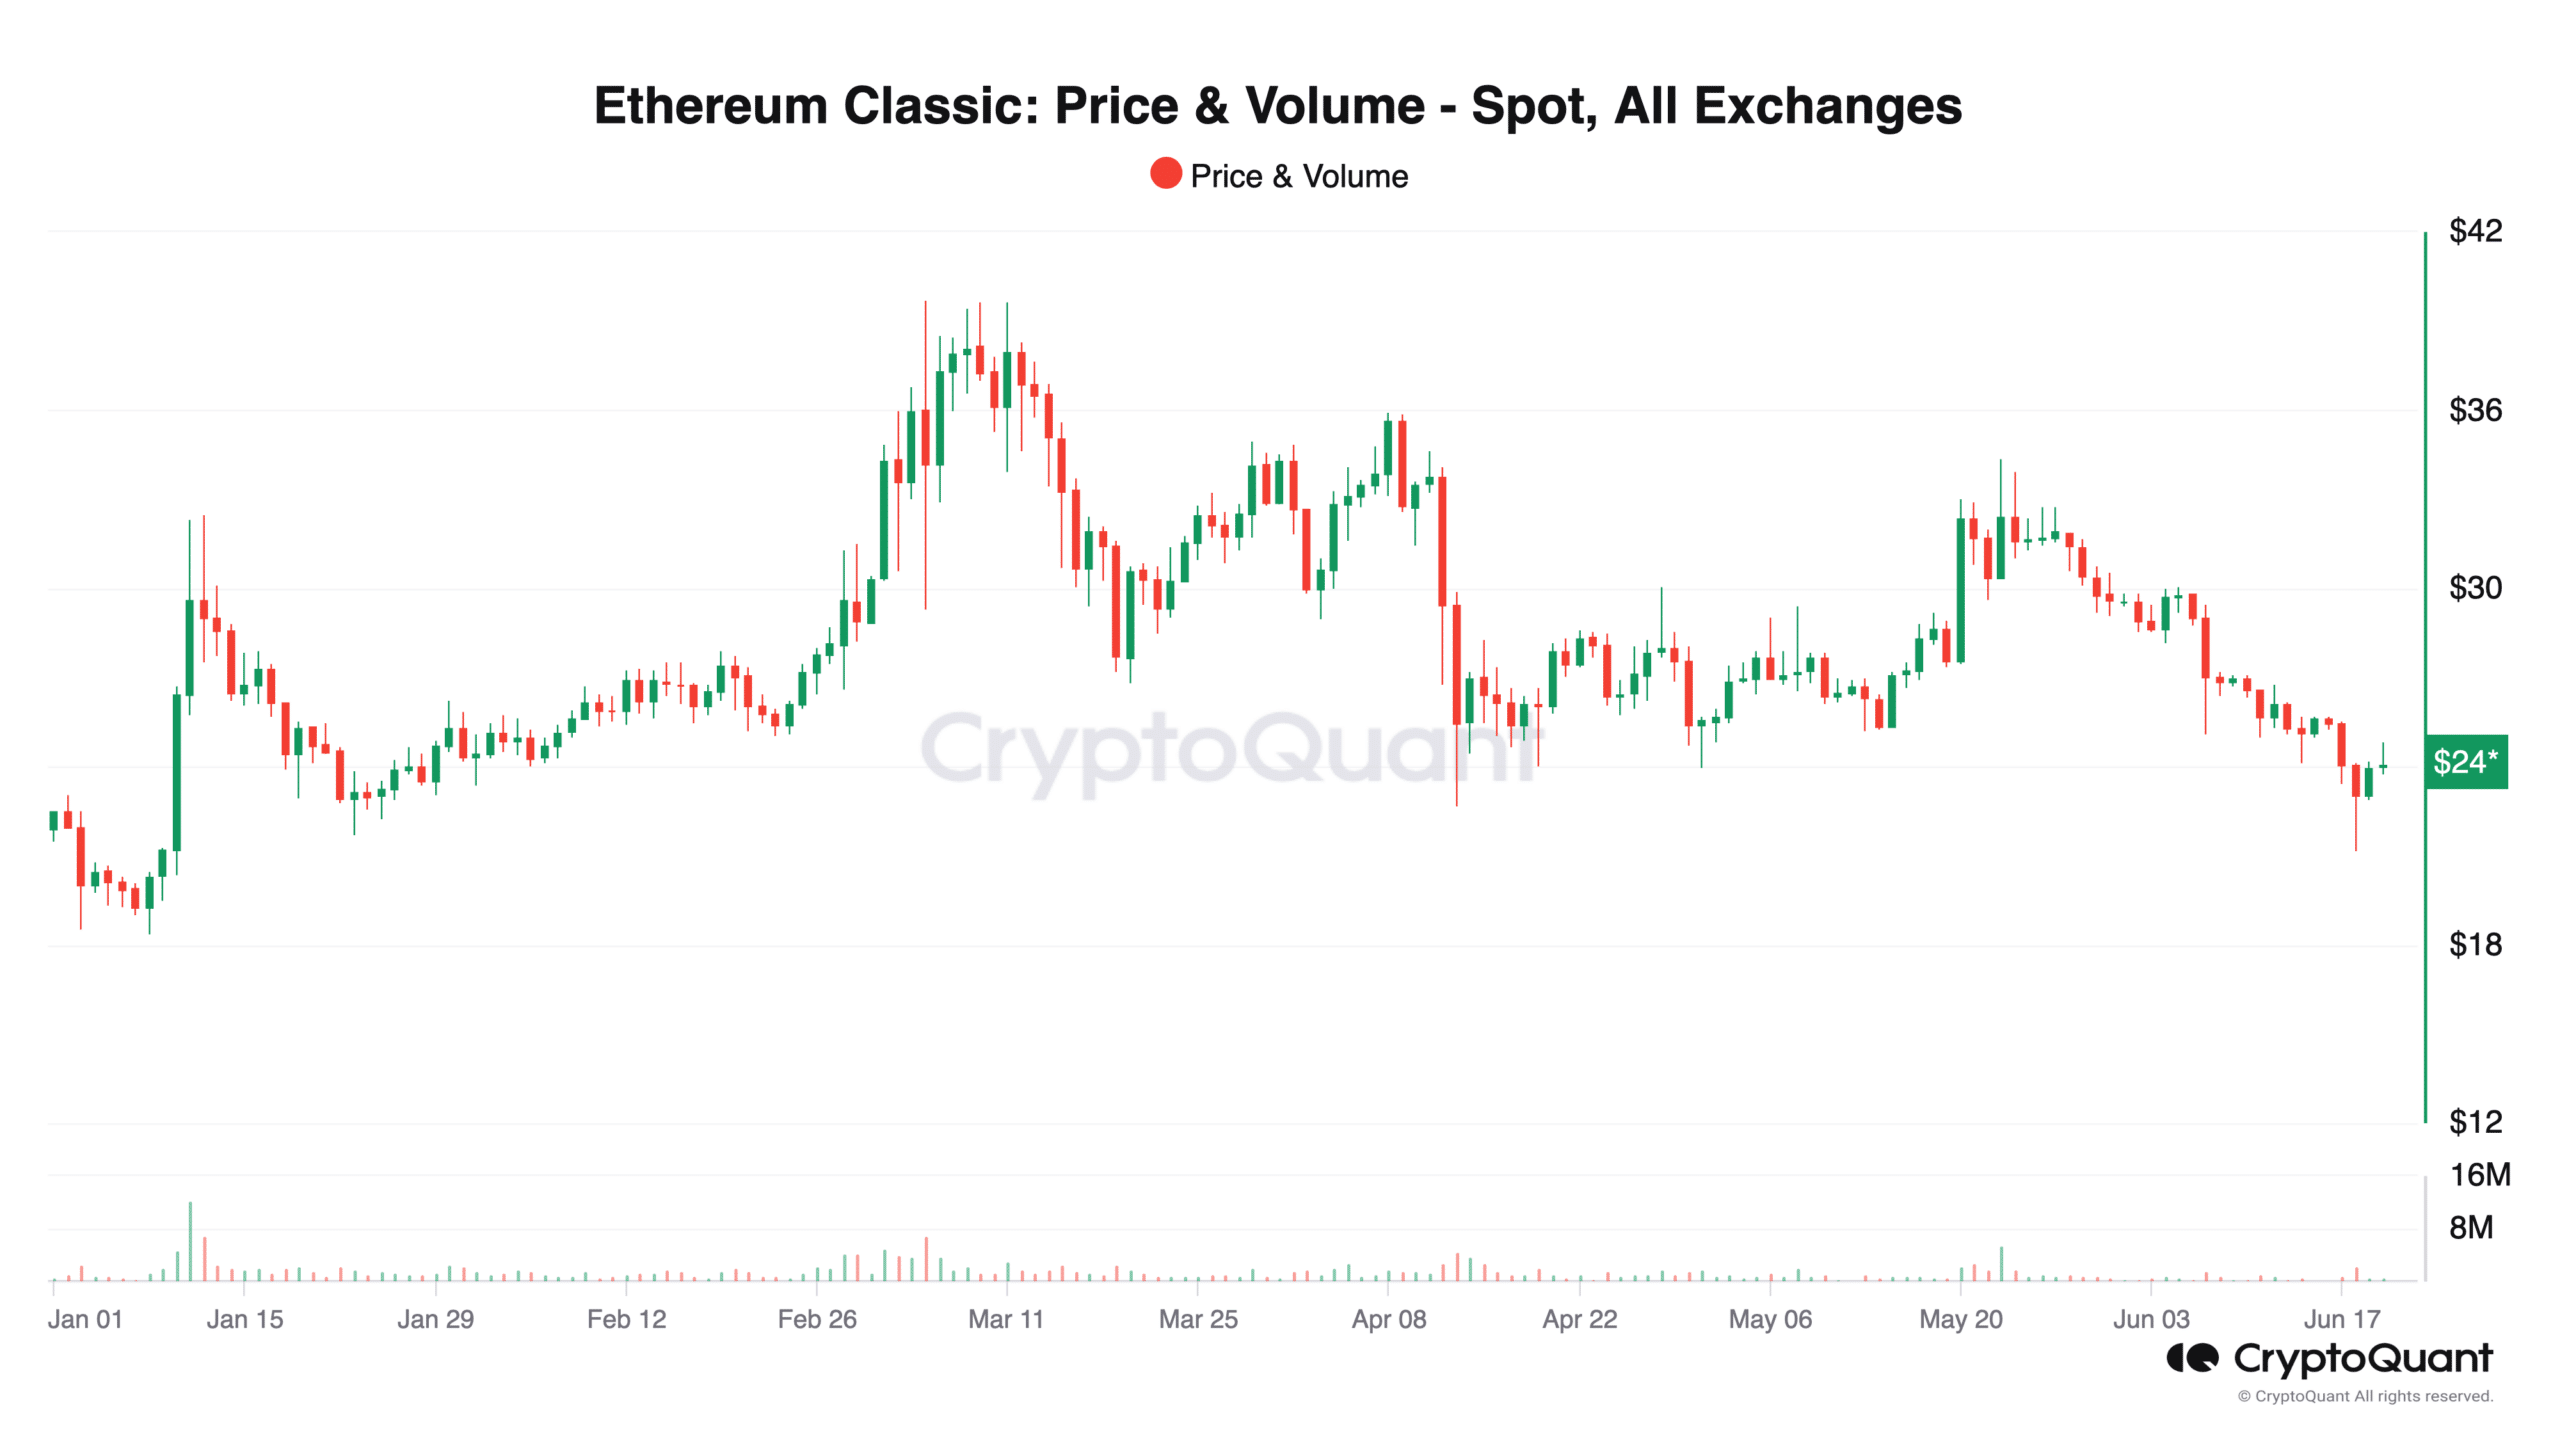
Source: CryptoQuant
Since late May and into June, the trend has appeared generally bearish as ETC’s price made lower highs and lower lows – A classic indication of a downtrend. This recent decline in price can be coupled with diminishing trading volume – A sign of a reduction in investor interest and market fatigue.
Typically, low volume during a downtrend might suggest a lack of conviction in the sell-offs, but it could also mean that fewer buyers are present to push the price back up.
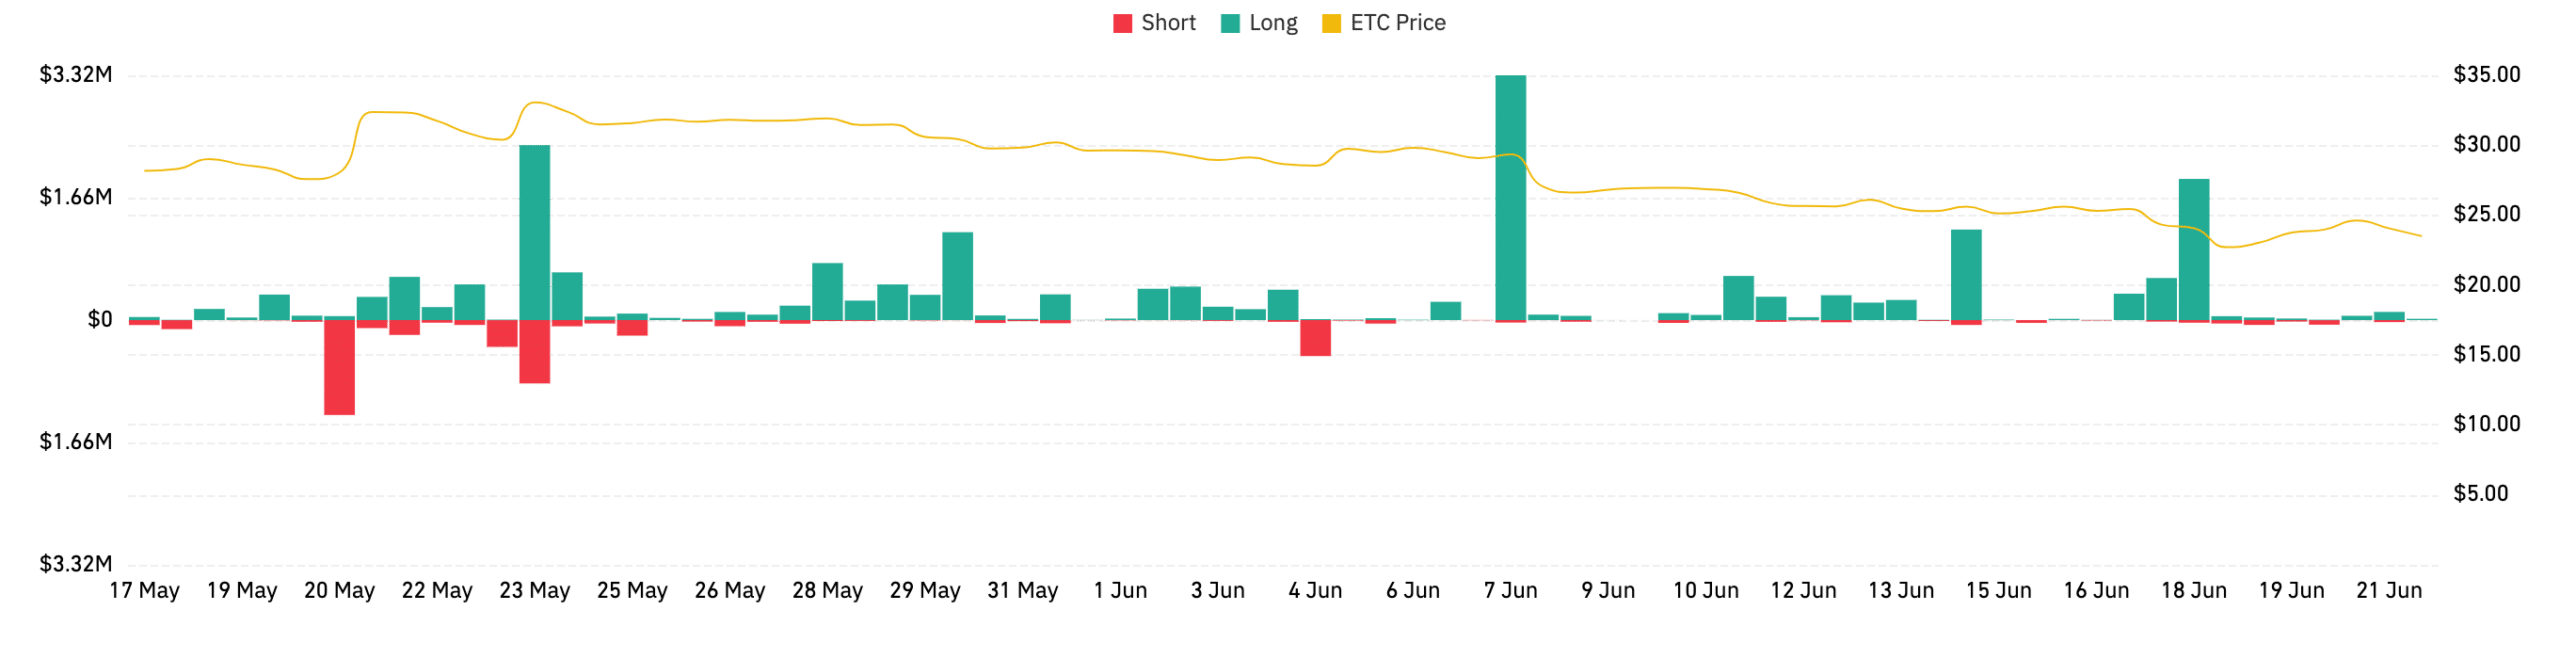
Source: Coinglass
A hike of +5.56% means heightened trading activity in ETC derivatives, which can be speculative buying or selling. In fact, the notable spike seemed to align with a peak in ETC’s price line, possibly pointing to a speculative rush that was not sustained and led to price retraction.
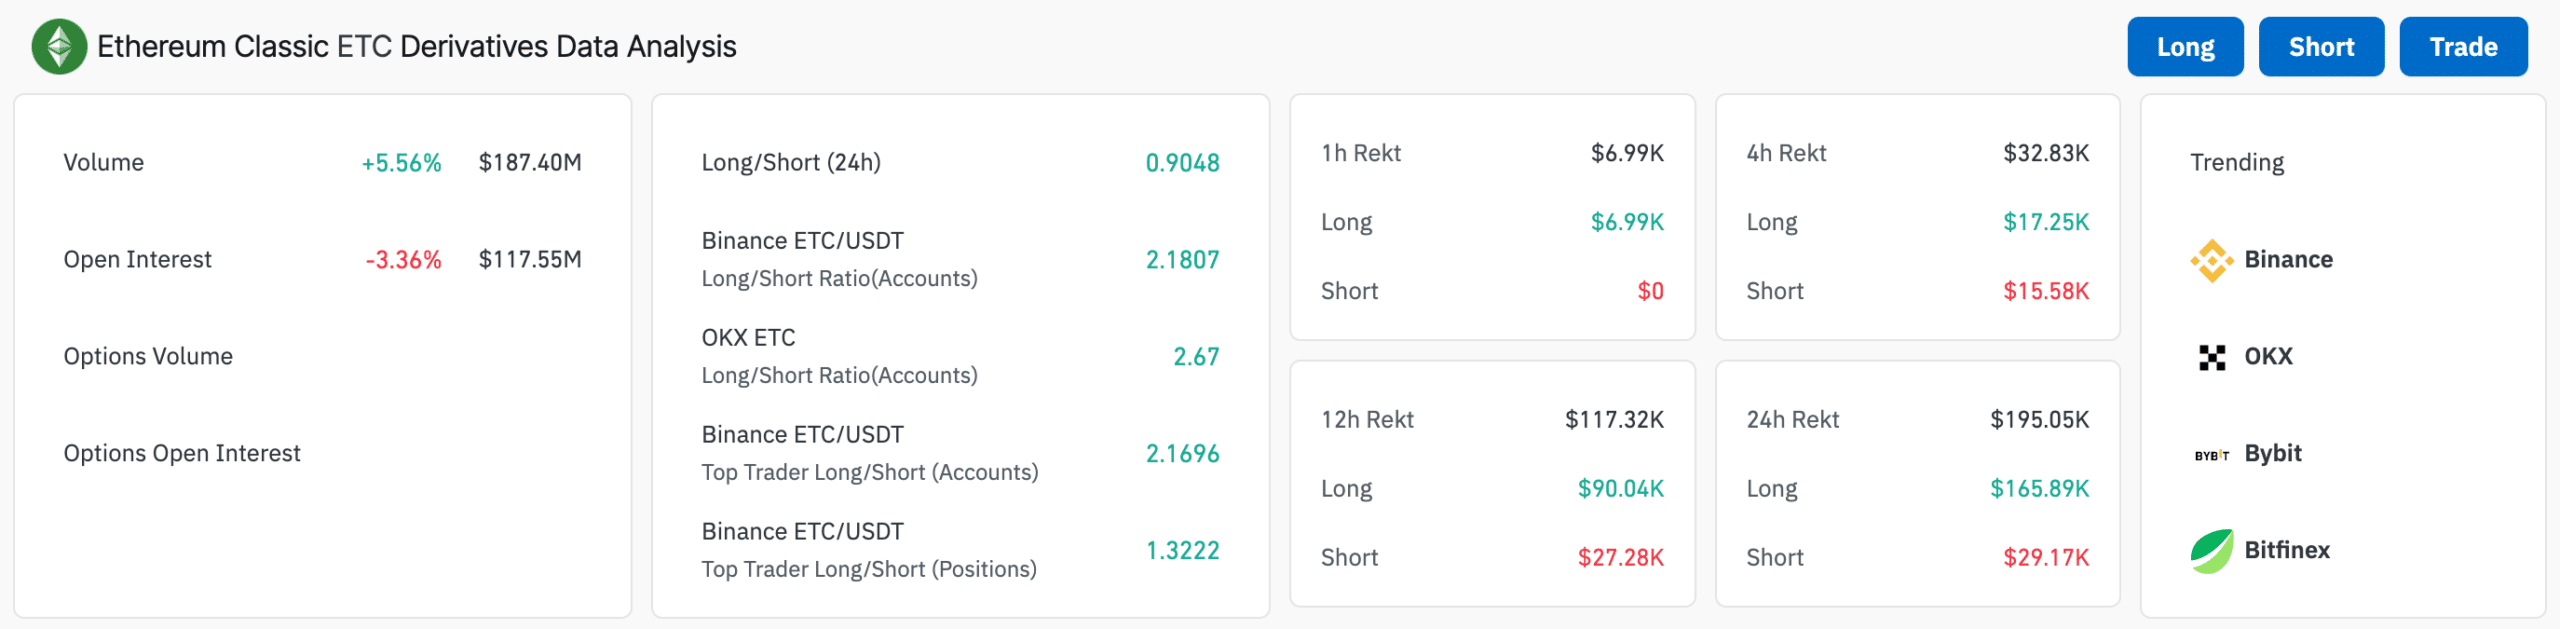
Source: Coinglass
Death Cross signals prolonged downtrend
The 50-day moving average recently crossed below the 200-day moving average, indicating a bearish ‘death cross.’ This pattern typically is a sign of a long-term downtrend.
The price peaked at around $35 in March, followed by a sharp decline. After that, it consolidated around the $30-mark before breaking below the 200-day moving average.
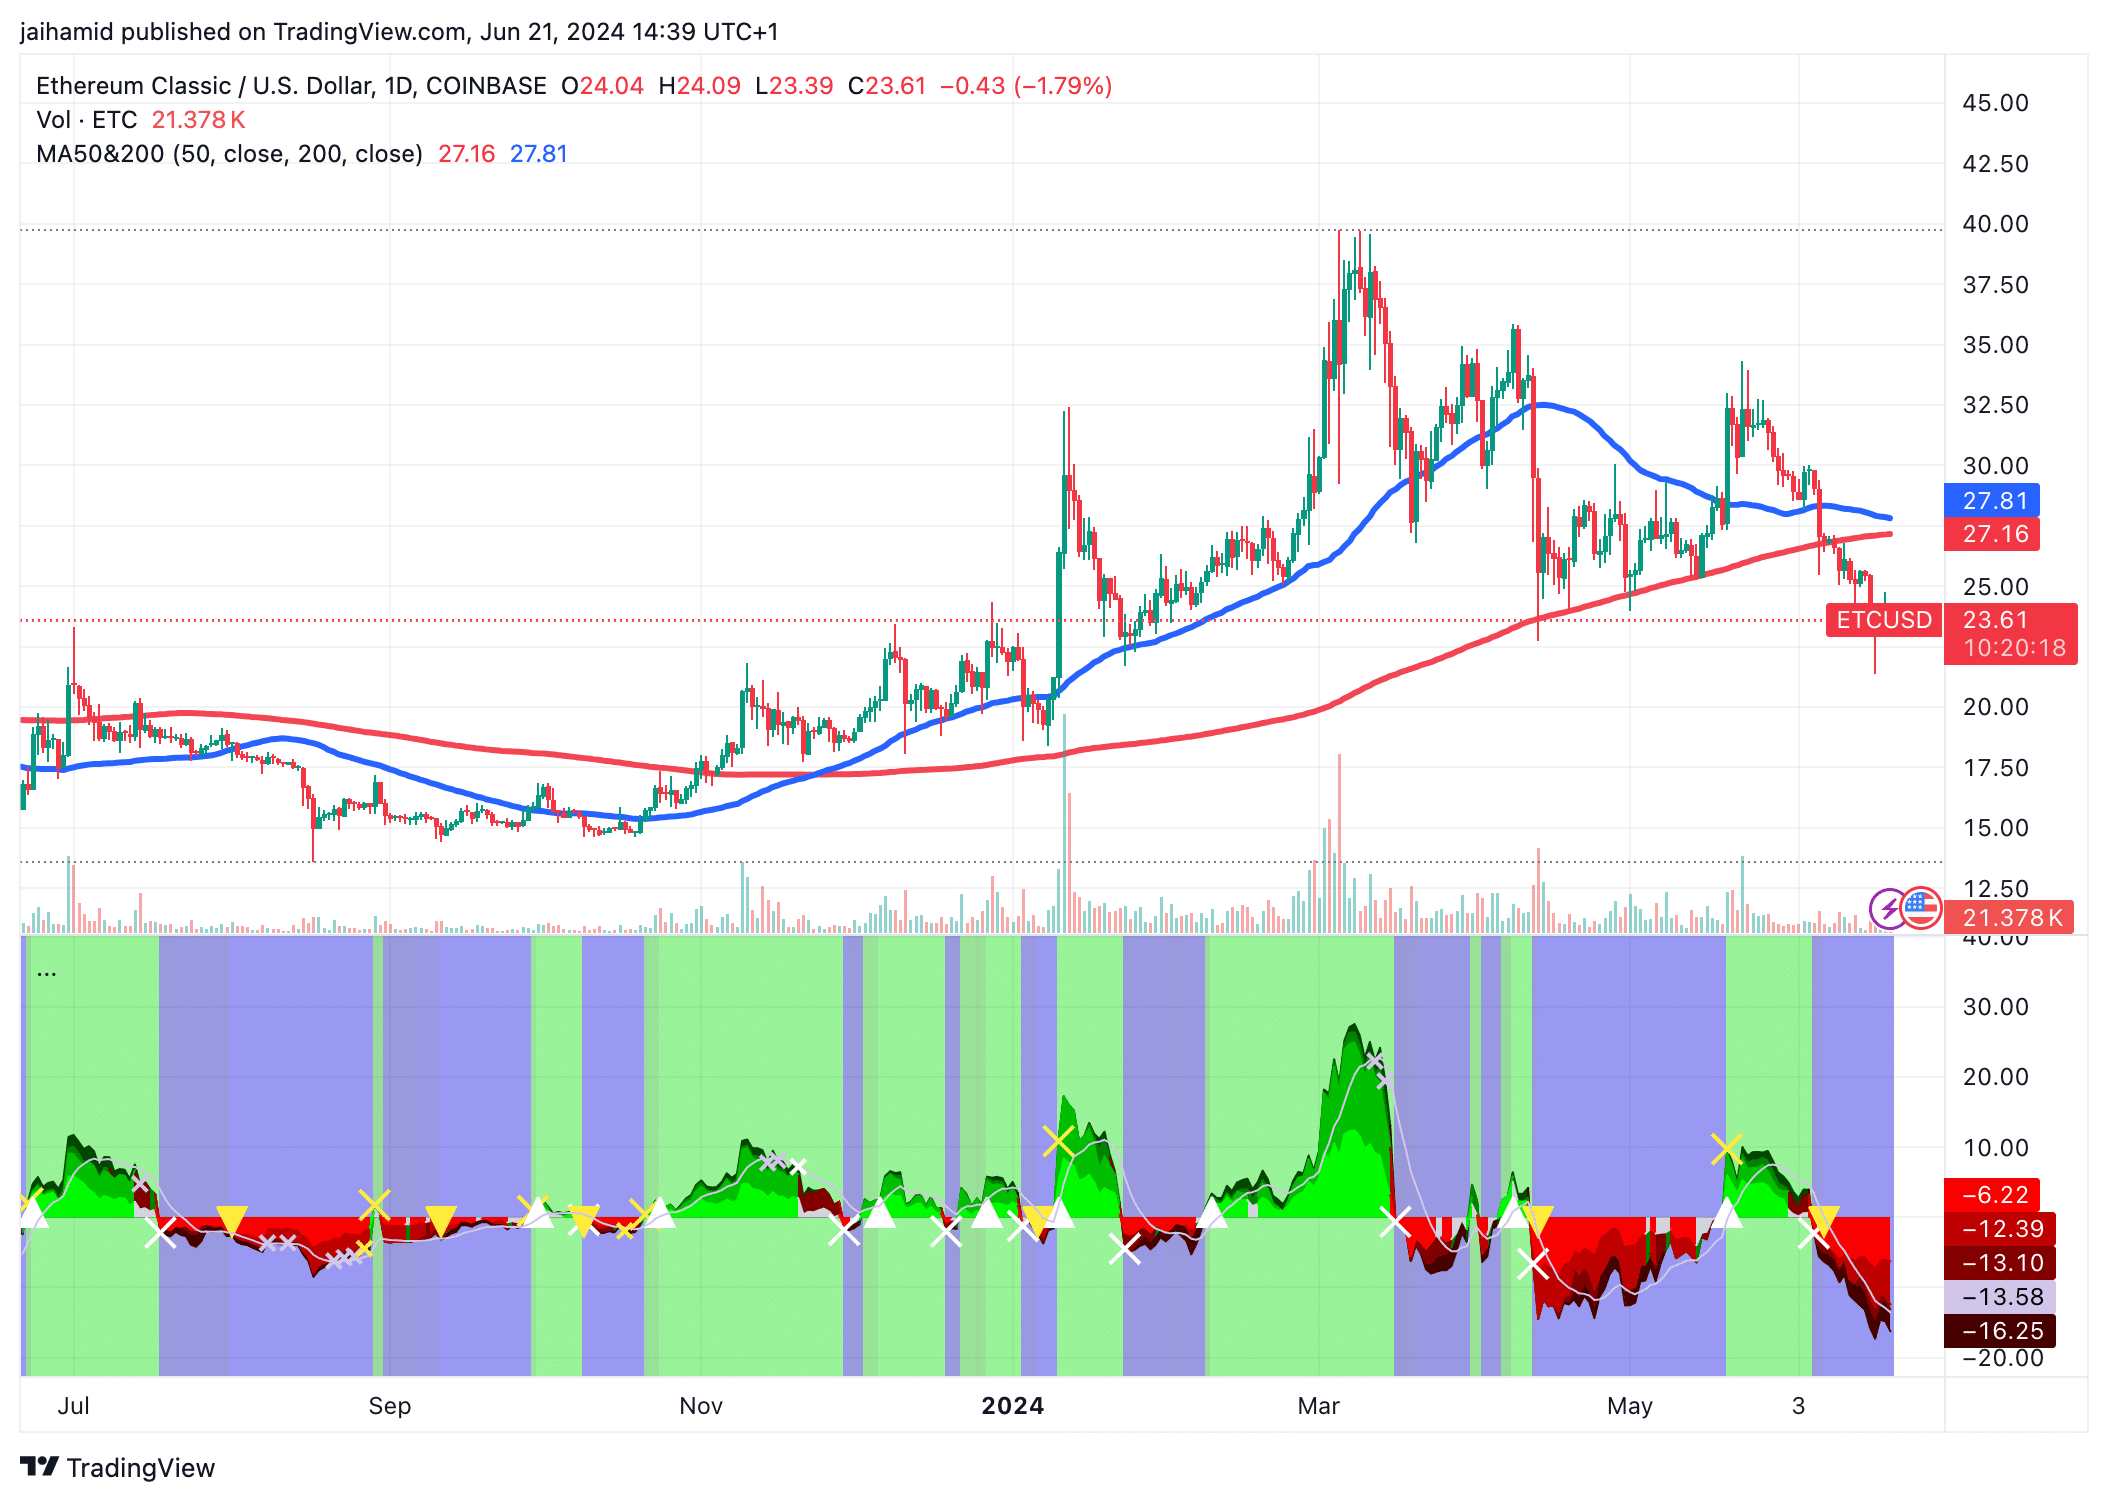
Source: TradingView
Previous support levels can be observed around the $25-level, which have now been breached and may act as resistances if a price recovery attempt occurs. The next key support is likely around the $20-level, which could be tested if the prevailing bearish trend continues.
In conclusion, the hike in selling volume plus the breach of prior support levels tells us that the bears are here to stay.
![Solana [SOL] gains on Ethereum [ETH] but faces sell-off risks](https://ambcrypto.com/wp-content/uploads/2025/04/5B92B32E-5F8B-49F6-94A3-D0086EF6CCA2-400x240.webp)


