Ethereum climbs back above $1200, but watch out for this resistance

Disclaimer: The information presented does not constitute financial, investment, trading, or other types of advice and is solely the writer’s opinion
- Ethereum approaches a bearish breaker on the 12-hour chart.
- Its move back above the mid-range mark offered bulls some hope that the range highs could be the next target.
Much like Bitcoin, Ethereum also had a quiet festive season on the price charts. Not much volatility was witnessed. In recent weeks, the $1160 and $1245 levels of support and resistance have been important.
Read Ethereum’s Price Prediction 2023-24
At the time of writing, Ethereum exchanged hands at $1217. Trading volume has also picked up marginally over the past couple of days. Could the birth of the new year see ETH climb back to $1350, or even higher?
The 12-hour bearish breaker at $1245 remains a challenge
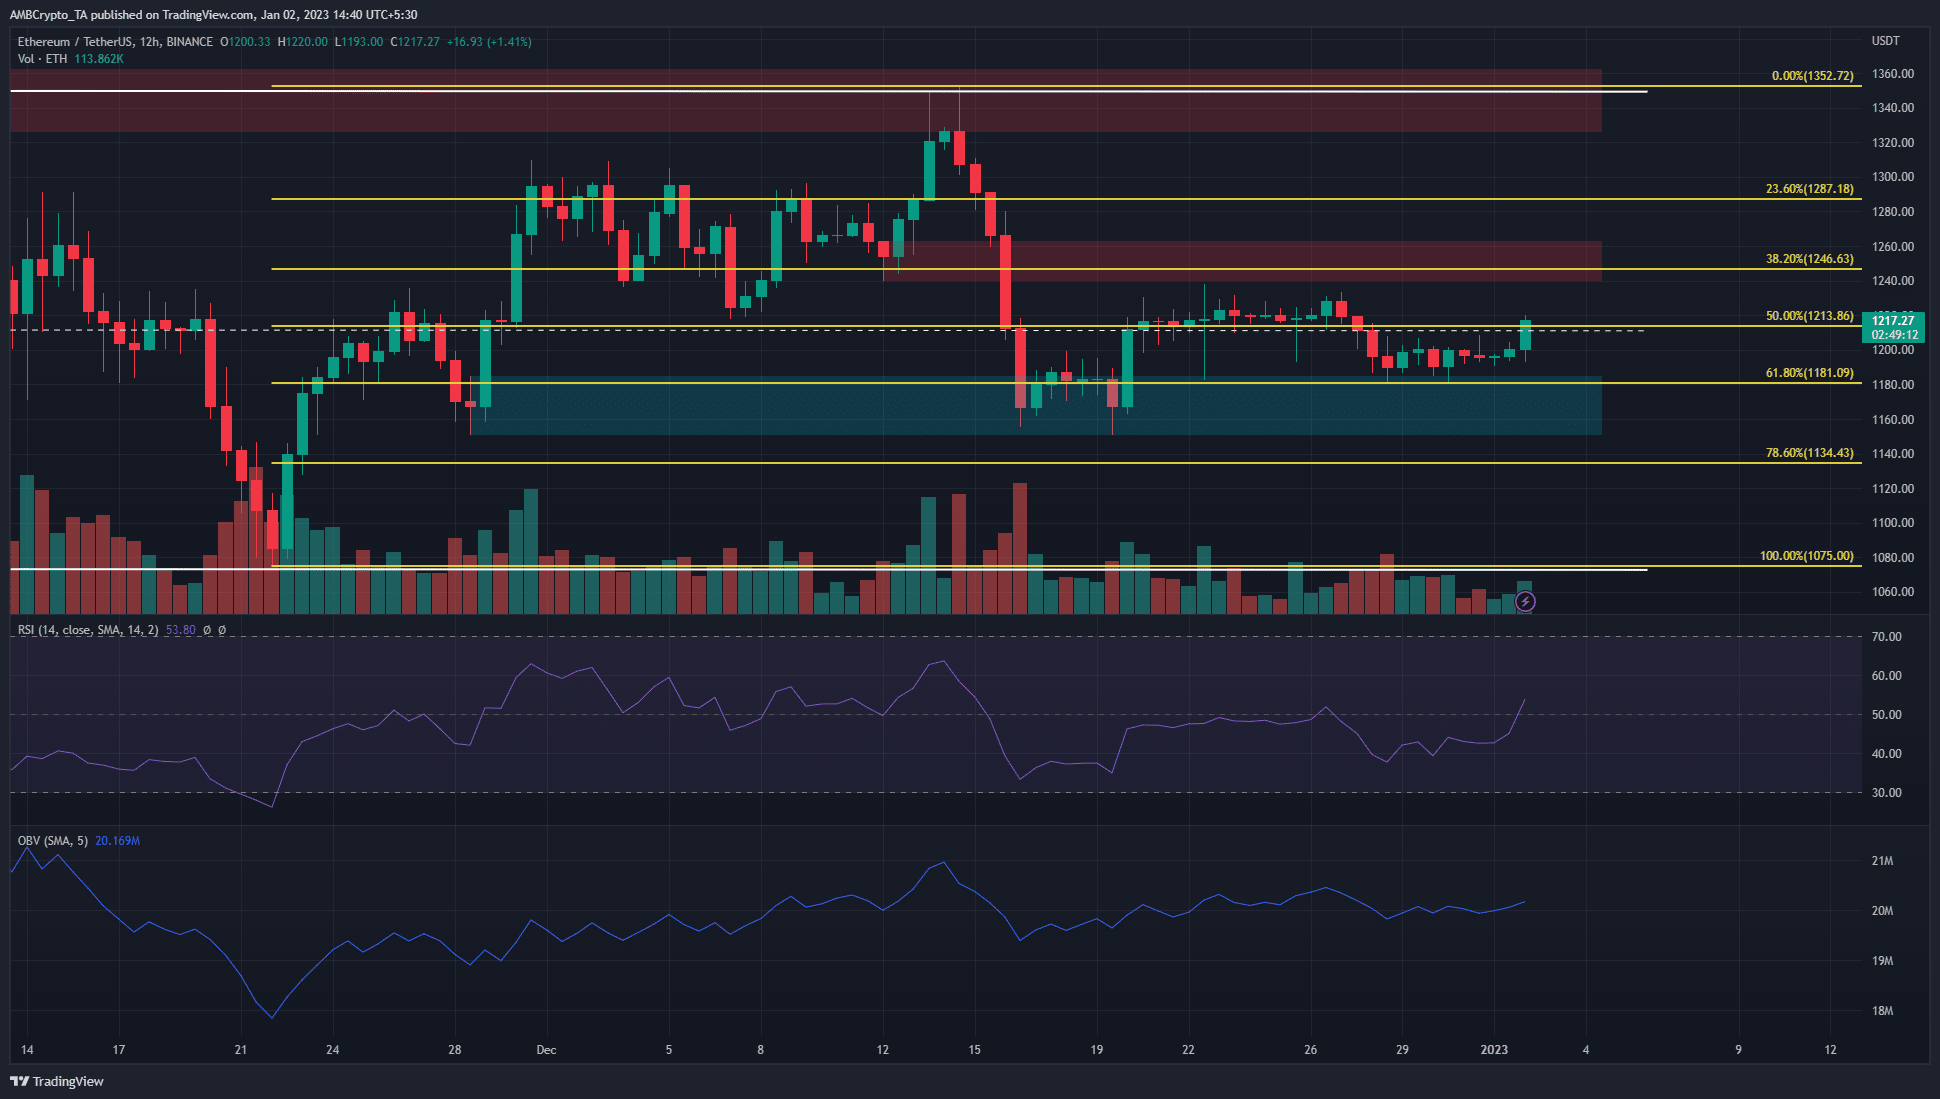
Ethereum has traded within a range extending from $1350 to $1075 since 10 November. On 12 December, ETH formed a bullish order block and climbed upward to the range highs at $1350 on 13 December.
A couple of days thereafter ETH faced a sharp rejection and fell back to the $1160 level. In doing so, the bullish order block was flipped to a bearish breaker.
Are your ETH holdings flashing green? Check the Profit Calculator
At press time, the market structure was bearish. ETH has formed a higher low after the mid-December drop but is yet to break above the lower highs at $1237. The RSI stood at 53.8 and could rise further if Ethereum registered more gains over the day.
The OBV has been flat since mid-December, which indicated neither the buyers nor the sellers have been particularly strong. Yet, the OBV has climbed since mid-November, which showed buyers had some success in recent months.
The higher timeframe charts showed that the $1300-$1350 area has seen a large volume of trading back in September and October. Therefore, alongside the bearish breaker, this area is likely to offer additional resistance to bullish pressure.
Spot CVD is in decline and the move back above $1200 forced short liquidations
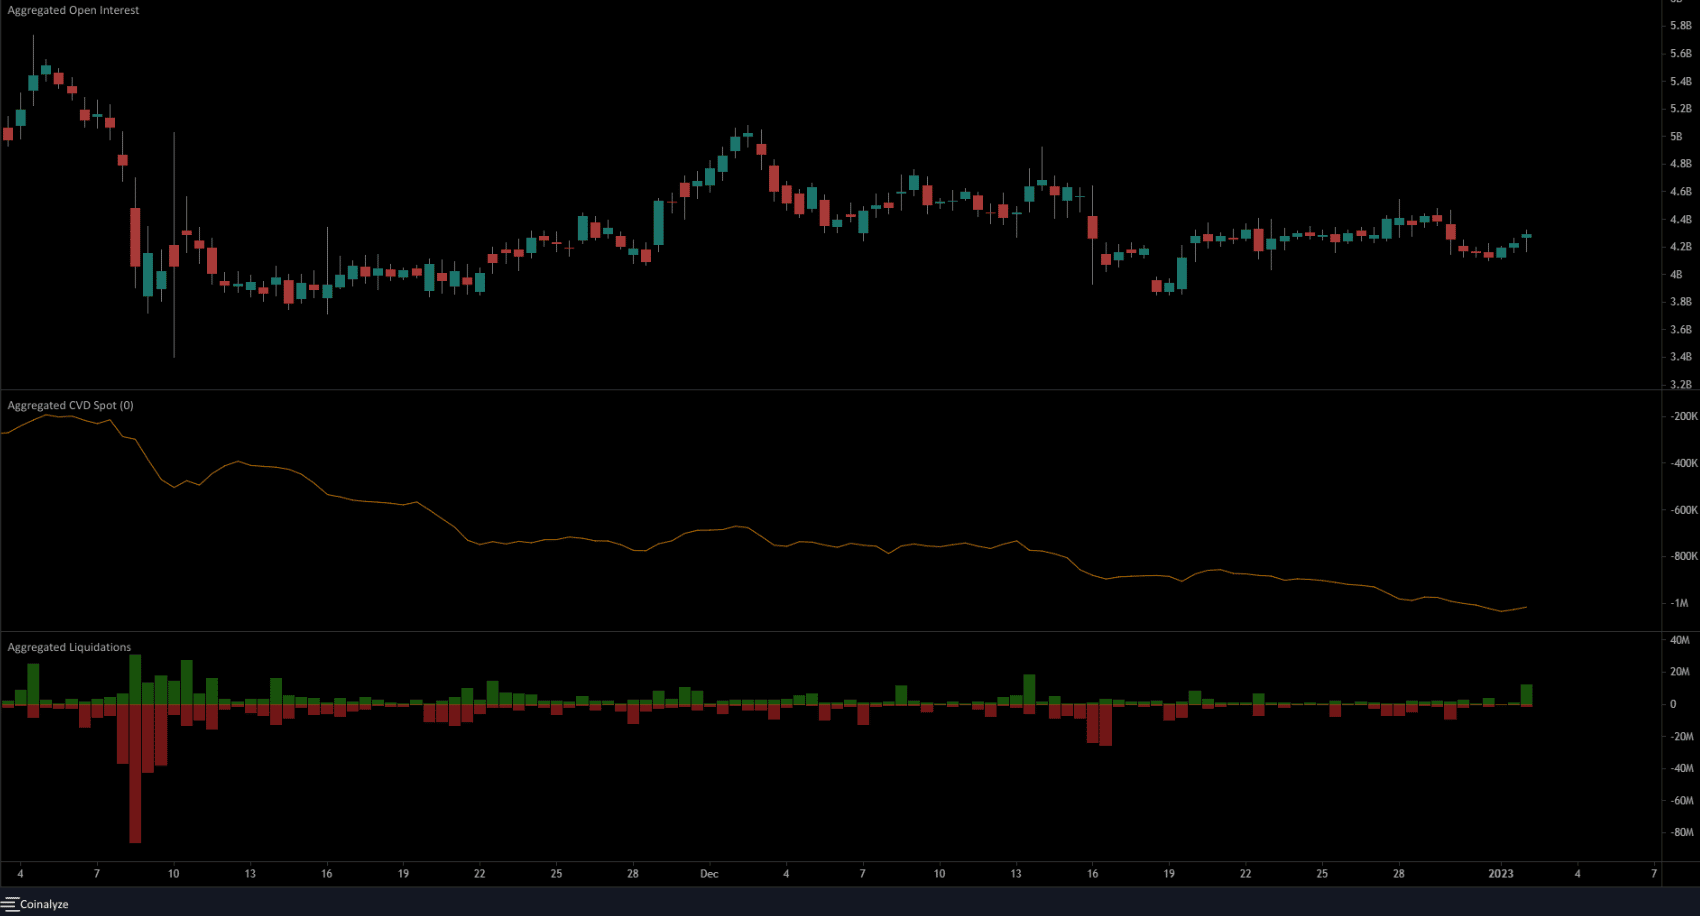
The spot Cumulative Volume Delta has been in steady decline in recent weeks. This highlighted a lack of demand behind ETH, which meant any significant bounce in prices are for the bears to sell.
The past 12 hours saw Ethereum post gains of nearly 2.5%. This was enough to liquidate $12.1 million worth of short positions. Bears can wait for a retest of the $1235-$1240 area before looking to short the asset. A move above $1240 and a retest could offer bulls a buying opportunity targeting $1350.