Ethereum Coinbase Premium Gap dips after spot ETF approval

- Since ETFs were approved, the Ethereum Coinbase Premium Gap has declined.
- The coin’s price remained prone to swings despite the decrease in volatility.
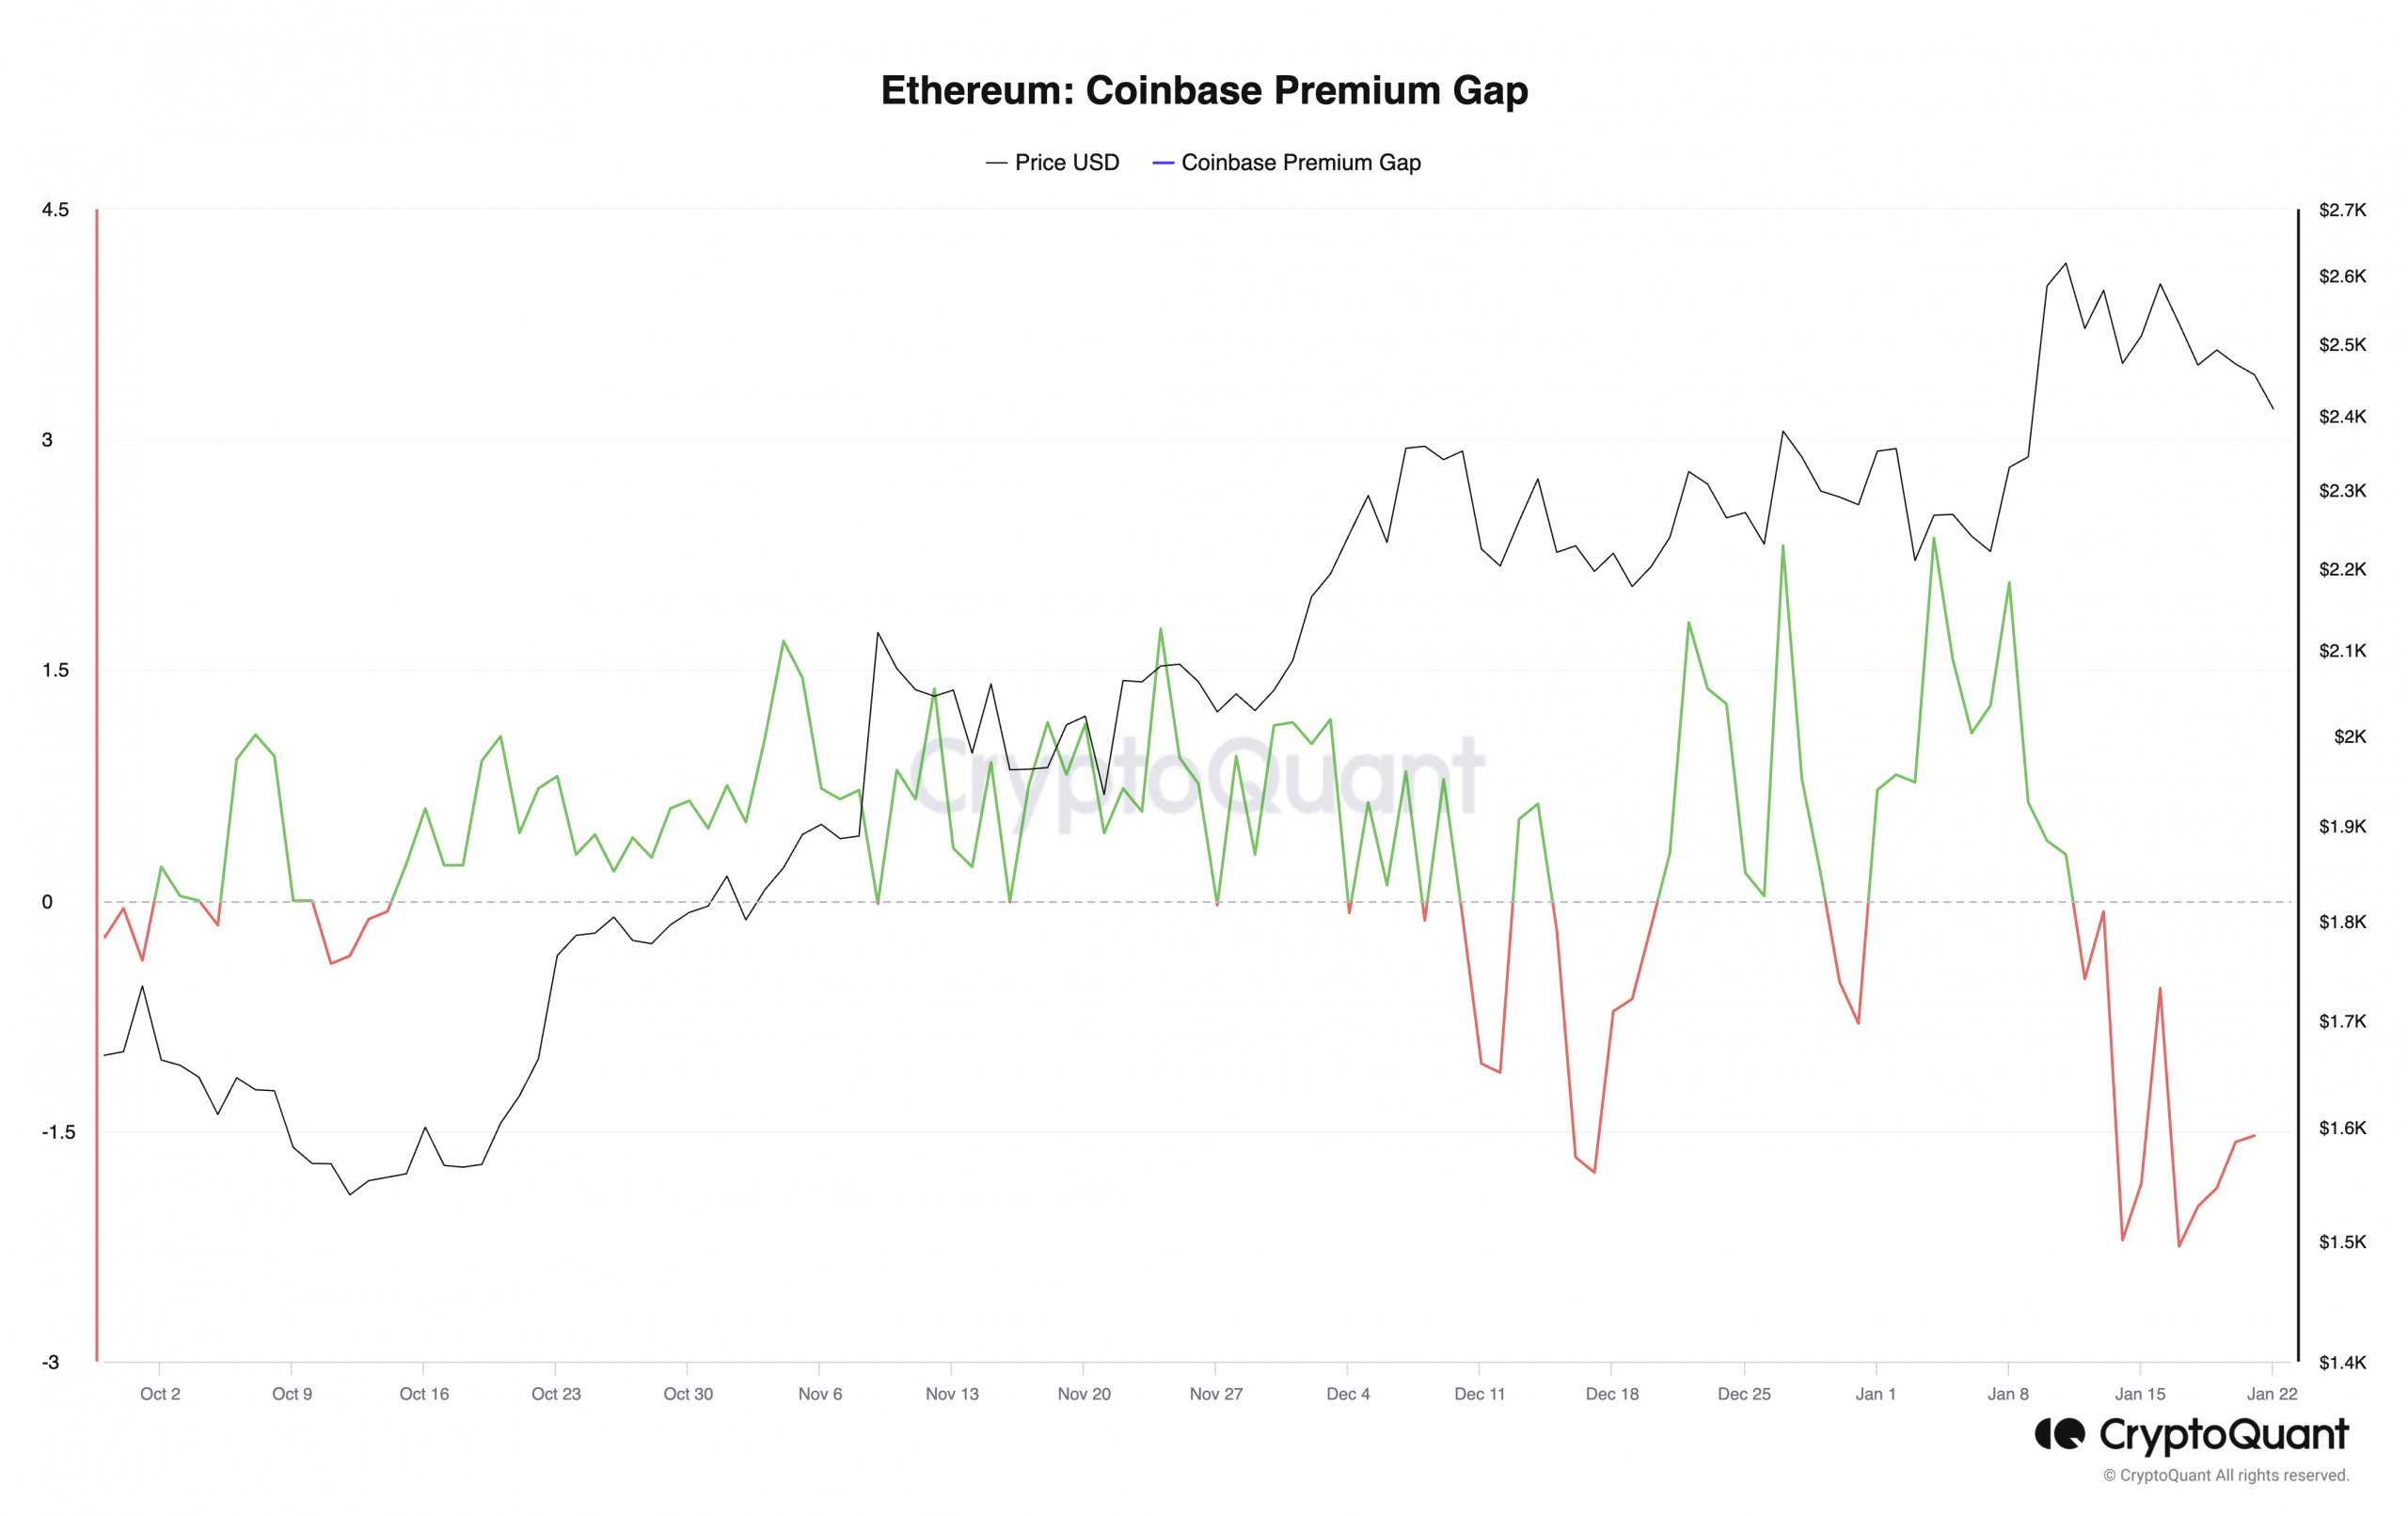
Ethereum’s [ETH] Coinbase Premium Gap has shrunk since the launch of Bitcoin [BTC] spot exchange-traded fund (ETF) on the 10th of January, data from CryptoQuant revealed.
This metric tracks the difference between ETH’s price on Coinbase and Binance. When this indicator returns a positive value and rises, it means that the coin is trading at a premium on Coinbase.
Conversely, when it declines, it means that the coin trades at a much lower price on Coinbase than on Binance, mostly due to a shift in sentiment or buying pressure between US-based investors.
According to data from CryptoQuant, ETH’s Coinbase Premium Gap was -1.53 at press time, declining by over 450% since BTC ETF went live.
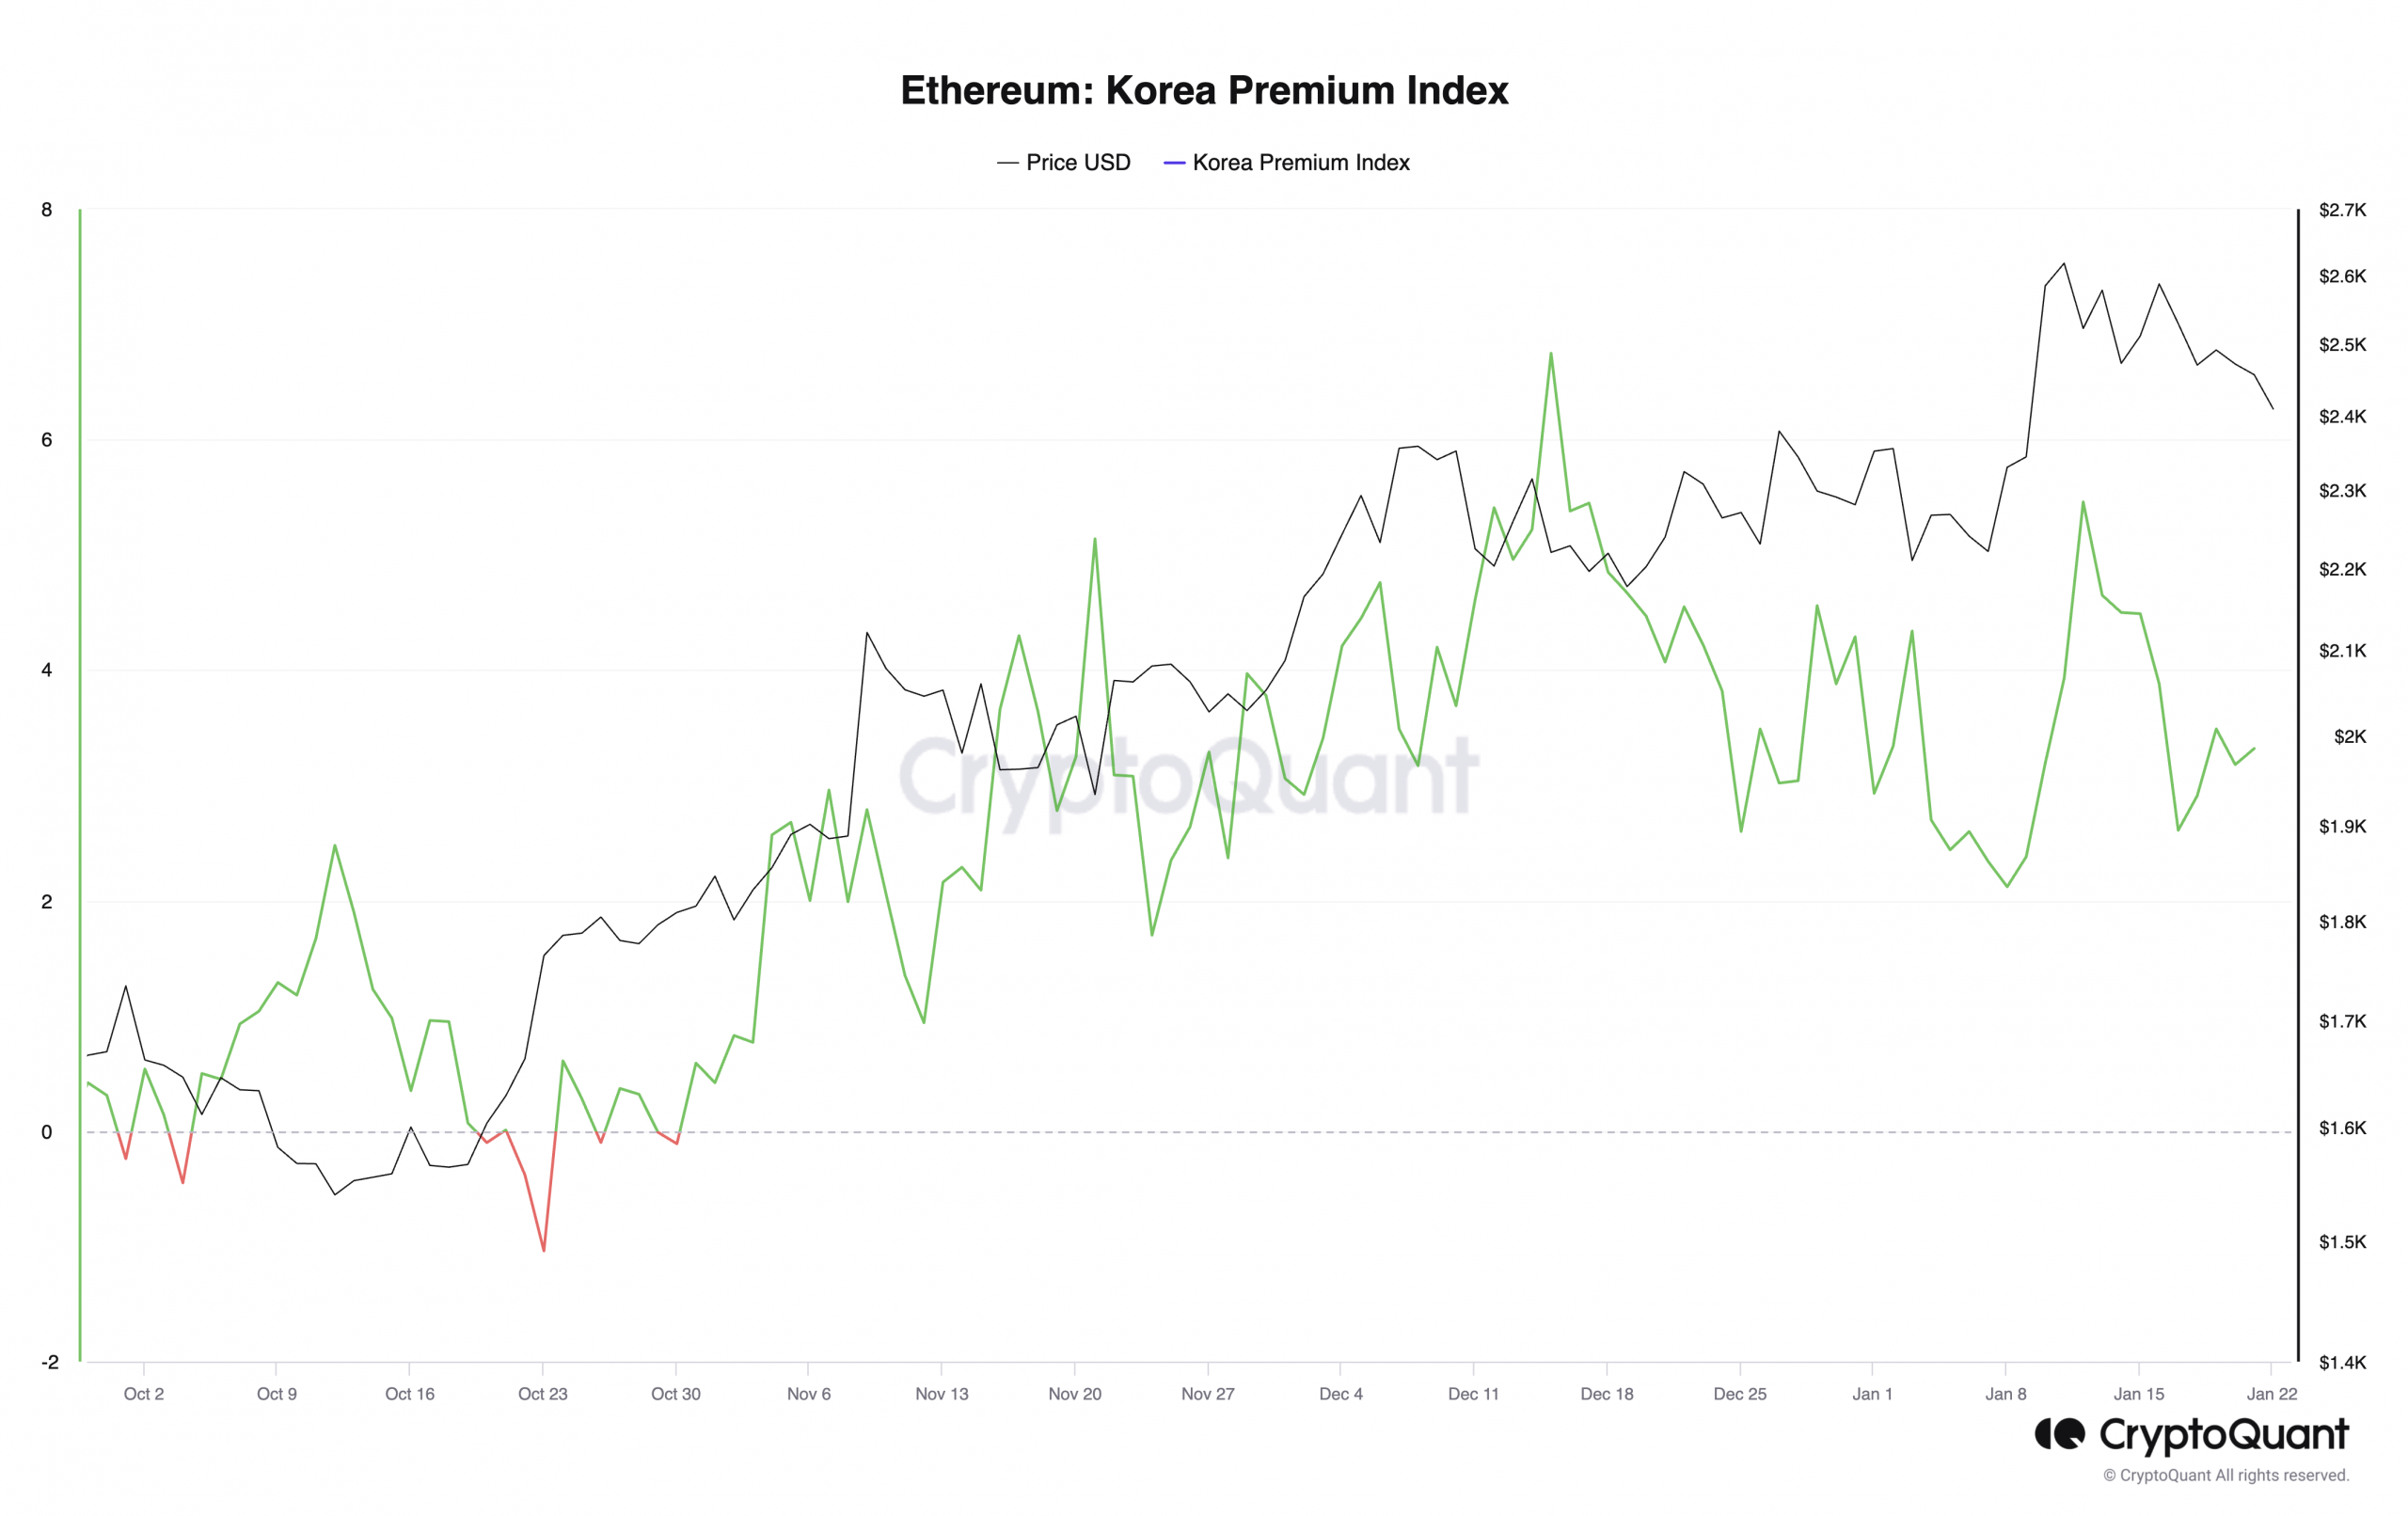
An assessment of the Asian markets revealed that the coin’s Korean Premium Gap stayed positive after BTC ETFs became tradable.
ETH’s Korean Premium Gap measures the price gap between South Korean exchanges and other exchanges. When it climbs, it indicates the presence of strong buying pressure among Korean retail investors.
As of this writing, ETH’s Korean Premium Gap was 3.32, per data from CryptoQuant.
Impending price volatility?
Coinbase ranks as the second-largest cryptocurrency exchange by volume. Hence, the sustained decline in ETH’s Premium Gap on the exchange is one to take note of.
This is because a sustained discrepancy between exchange prices could increase Ethereum’s market volatility.
An assessment of the coin’s Bollinger Bands (BB) indicator on a daily chart showed a steady widening of the gap between this indicator’s upper and lower bands.
Whenever this gap widens, it signals that an asset’s price deviates more from its average.
However, at the same time, ETH’s Average True Range (ATR) and its Chaikin Volatility, which are also market volatility markers, have trended downward.
At press time, ETH’s ATR was 102.20, falling by 18% since the 12th of January. Likewise, the coin’s Chaikin Volatility has since plunged by over 150%.
Is your portfolio green? Check out the ETH Profit Calculator
When these indicators trend downward, it suggests a decrease in the volatility of an asset’s price movements.
Therefore, while ETH’s BB indicator hints at potential price swings, the declining ATR and Chaikin Volatility suggest that the trend has become less volatile.


