Ethereum
Ethereum continues bearish path in the charts as price consolidates lower
Ethereum was trading at $171.86 with a total market cap of over $18 billion with a downfall of 2.49% on the 24-hour price chart.
1-hour Price chart
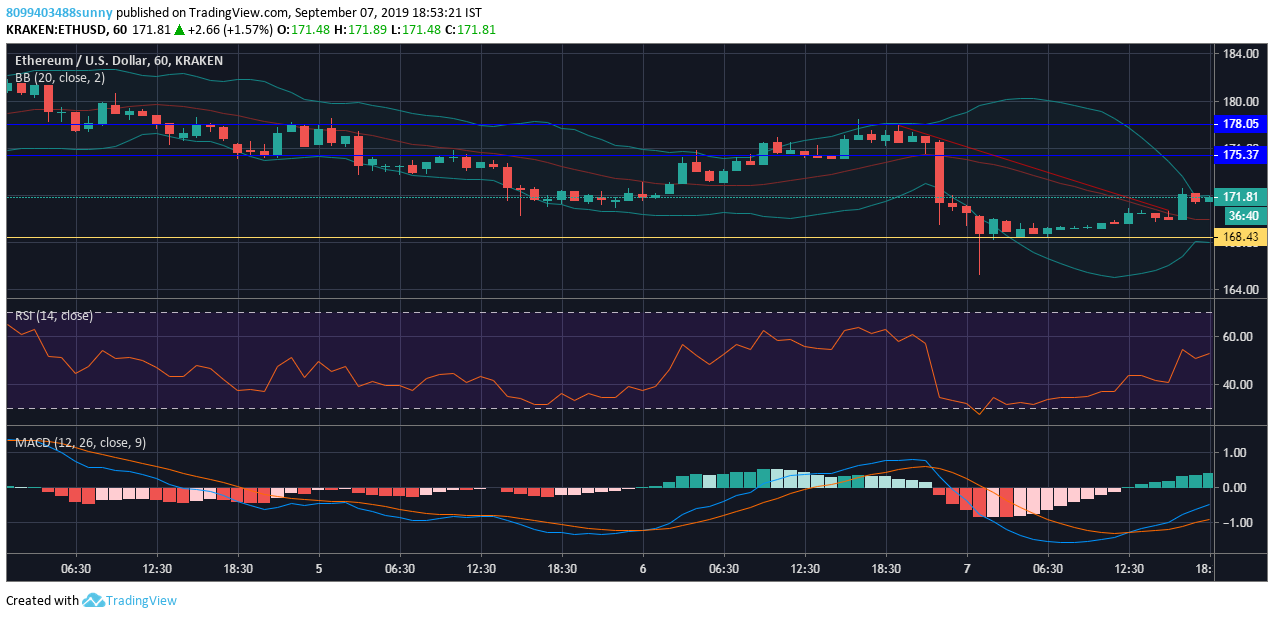

In the one-hour price chart, Ethereum is forming support at $168.43 while the immediate resistance is at $175.37 if it breaks through that the next resistance is at $178.05. Ethereum was showing a downward trend from $177 to $170.
The Bollinger band indicator shows high price volatility starting from 7th September but slowly towards the end of the day the gaps are closing in.
The RSI indicator indicated that the Ethereum was oversold for the most part on September 7th, suggesting higher Barish sentiment
The MACD indicator indicated that bears have an upper hand in the current market.
1-day price chart

In the one-day price chart, the support is forming at $165.72, while the resistance price that Ethreum needs to break through stands at $183.25. Ethereum is also seeing a downward trend stating from $239 till $178.
The Parabolic SAR indicator showed that the marker is above the candles since 10th August suggesting bearish sentiment in the market.
The Awesome Oscillator showed that it remained below the zero lines since July suggesting short term momentum is falling faster than the long term.
The Chaikin Money Flow or CMF showed that the selling pressure has been higher since 15th July which eased up in August, however it is again rising.
Conclusion
The Ethereum price analysis of 1-hour and 1-day show bearish sentiment is high while the selling pressure is getting higher.