Ethereum continues to struggles: Bears eye drop below $3K
Ethereum's daily RSI concurred with the bearish structure with a reading below 50. What does this mean for ETH?

- Ethereum was unable to reclaim $3.4k as support during the most recent try.
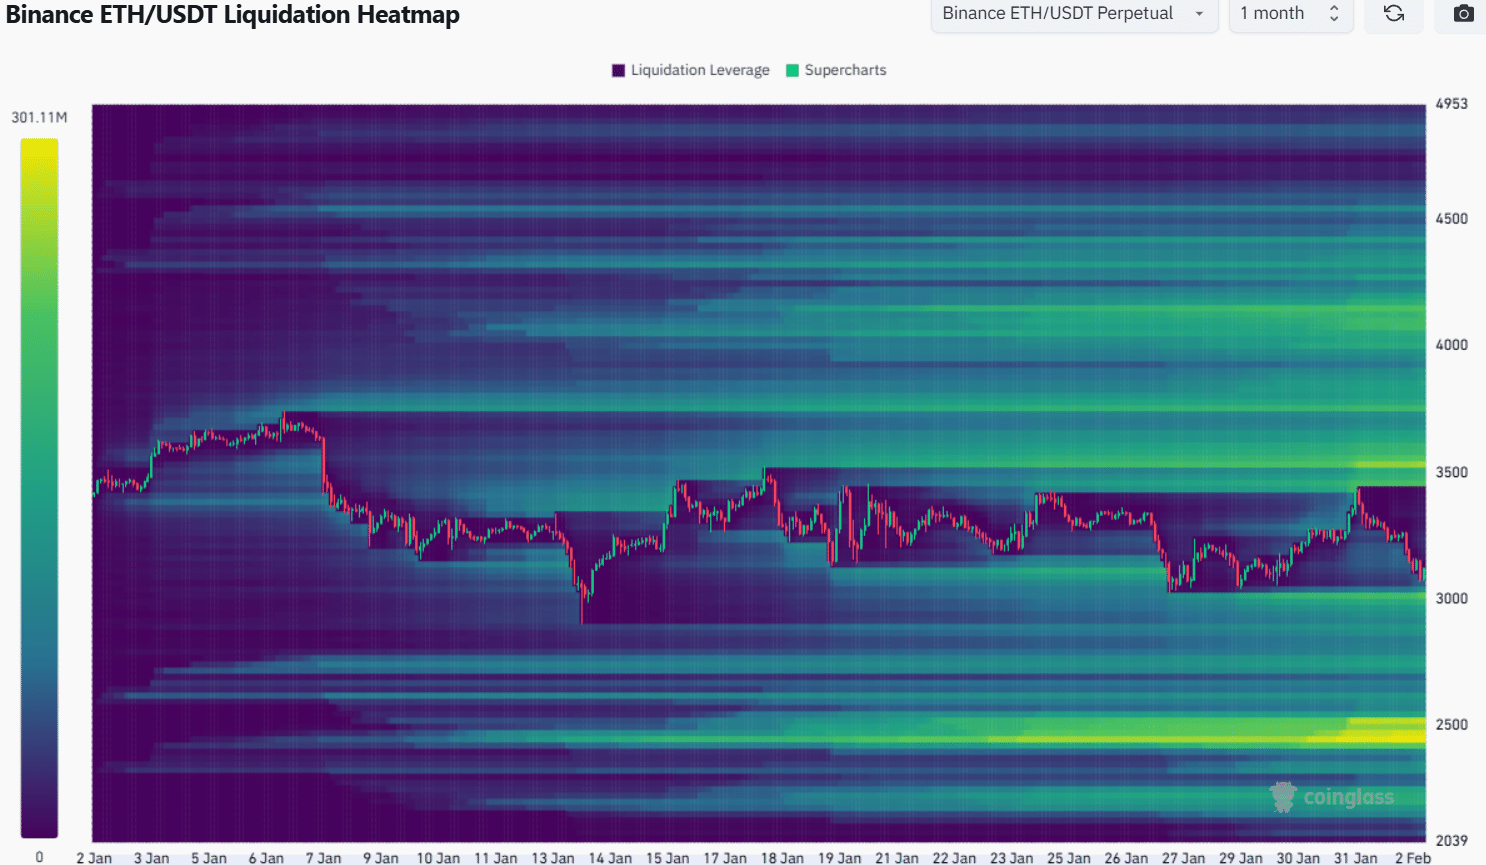
- The liquidations data showed that price is poised for a move below $3k soon.
The Ethereum [ETH] leadership has faced criticism, specifically inefficiencies and a lack of direction.
In an informal poll, 97% of 335 voters holding 51,198 ETH supported Danny Ryan, a former researcher, to lead the Ethereum Foundation.
Vitalik Buterin has clarified that he is the sole decision maker for the EF leadership changes.
Analysis of long-term on-chain metrics showed that long-term holders were confident in ETH, with only moderate profit-taking seen from the LTH NUPL metric.
This was not enough to halt the steady downtrend of the altcoin king in recent weeks.
Ethereum bulls falter at $3,400 once again
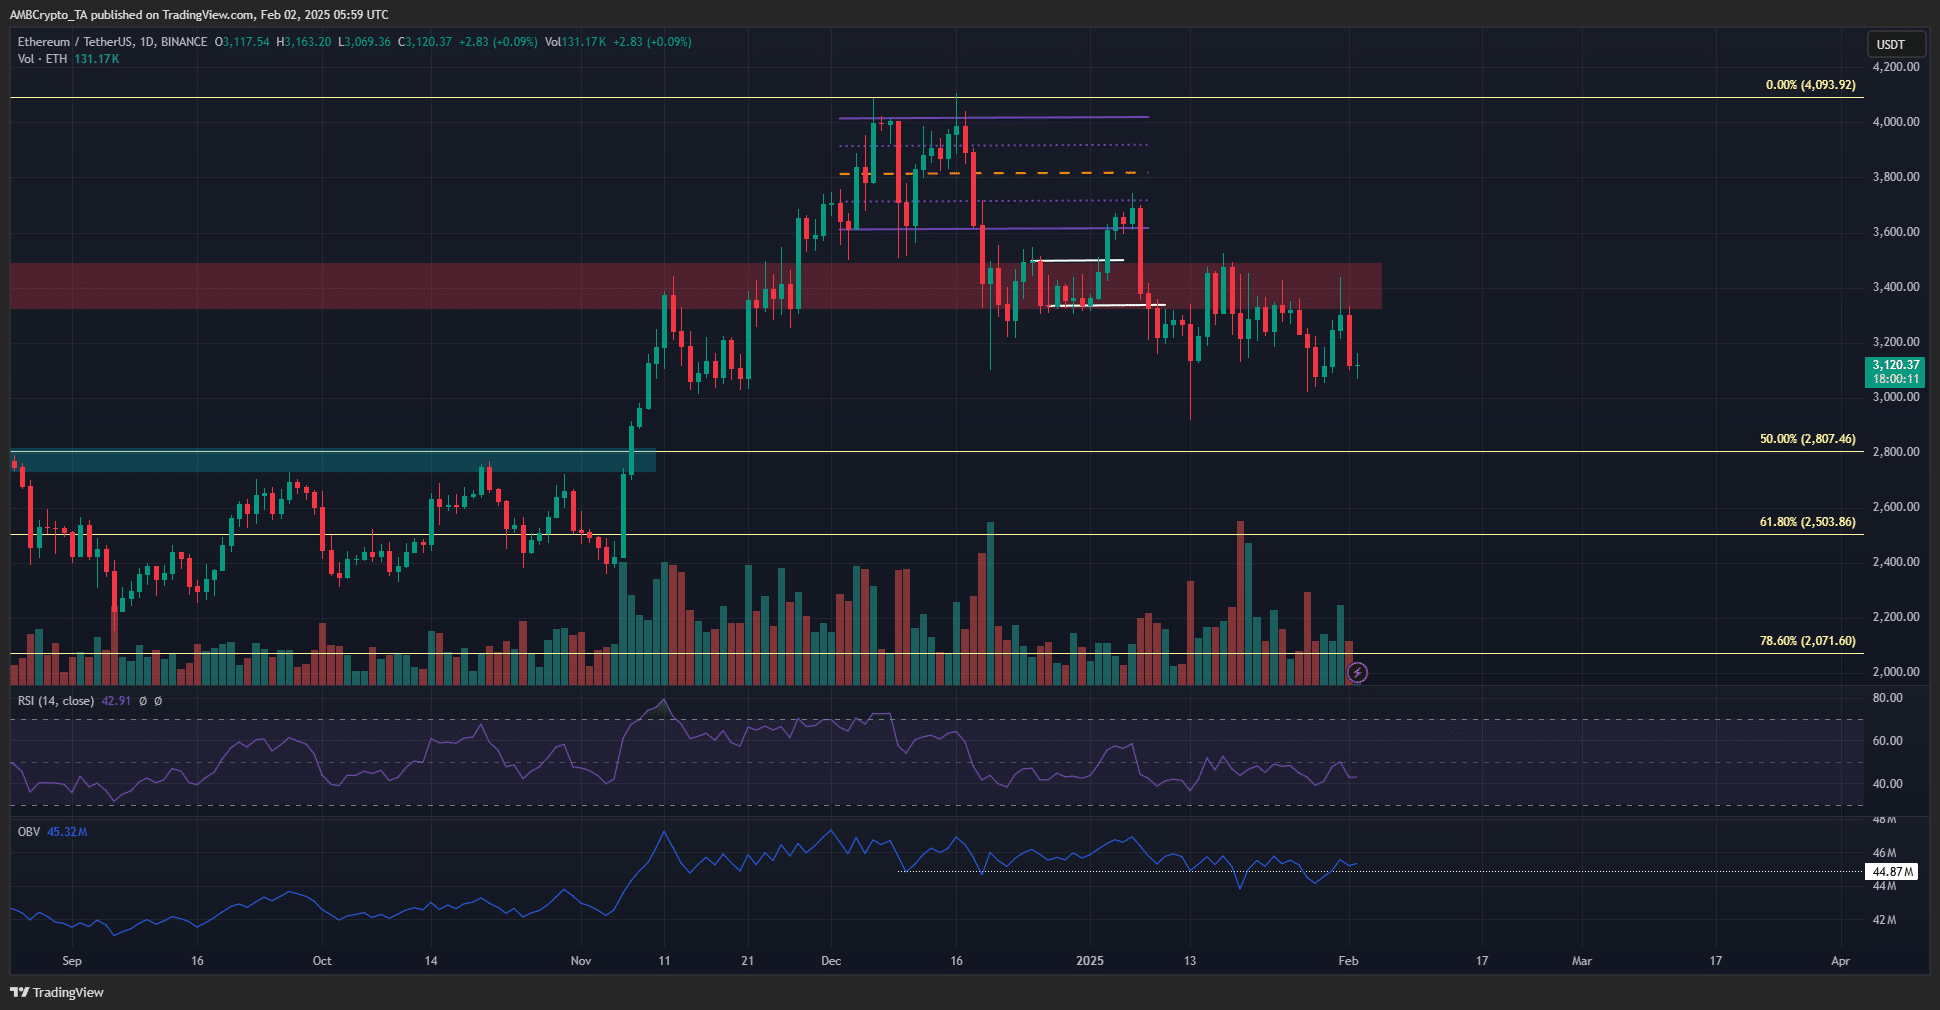
In June and July of 2024, the $3.4k-$3.5k acted as a support zone for ETH before it was flipped to resistance. The rally in November saw this area tested and a pullback ensue.
In the months since then, this region has been of vital importance.
A rally beyond $3.5k in January was quickly reversed, and the price action has formed lower highs and lower lows since then.
The quick gains on the 30th and 31st of January saw short-term gains across the altcoin market, but they were short-lived.
The daily RSI concurred with the bearish structure, with a reading below 50. Also, the OBV was hovering around a support level from November and December.
The volume indicator was evidence for the weakness of the buyers.
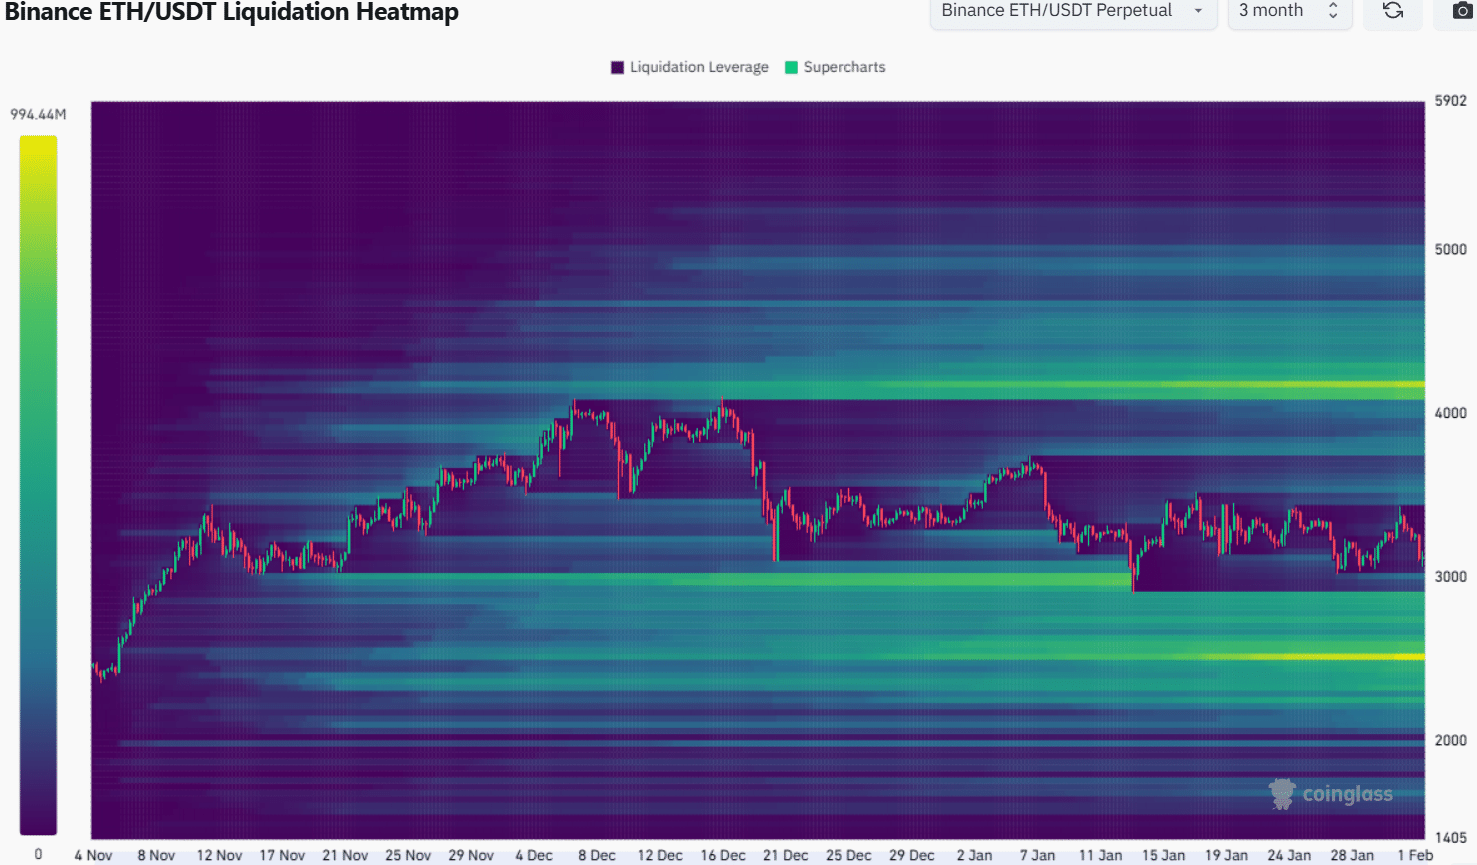
The 3-month liquidation heatmap showed that a move to $2,850 was highly likely. To the north, there were liquidity pockets at $3,460 and $3,800, and a sizable cluster at $4.2k.
The magnetic zone at and below $3k suggested that a move downward was the most likely outcome in the coming days. This was in agreement with the price action of the past month.
Is your portfolio green? Check the Ethereum Profit Calculator
The liquidation heatmap showed that $3k, $2.8k, and $2.7k were the next targets.
It is unclear if all these targets will be met in the coming weeks. The sentiment around Bitcoin [BTC] was weak, and traders should wait for more favorable conditions before looking to go long.
Disclaimer: The information presented does not constitute financial, investment, trading, or other types of advice and is solely the writer’s opinion