Ethereum, Cosmos, Near Price Analysis: 16 March

As the king alt finally found a close above the $2,600-level, it jumped above its 20/50 EMA. Now, as it flashed a bullish edge on its technicals, it endeavored to challenge its reversal pattern on the 4-hour chart.
Cosmos faced a strong rejection of higher prices at the $27-mark while its 20 EMA continued to be a hurdle. On the other hand, Near managed to break out of its pattern but its RSI still needed a close above 50 to confirm a change in momentum.
Ether (ETH)
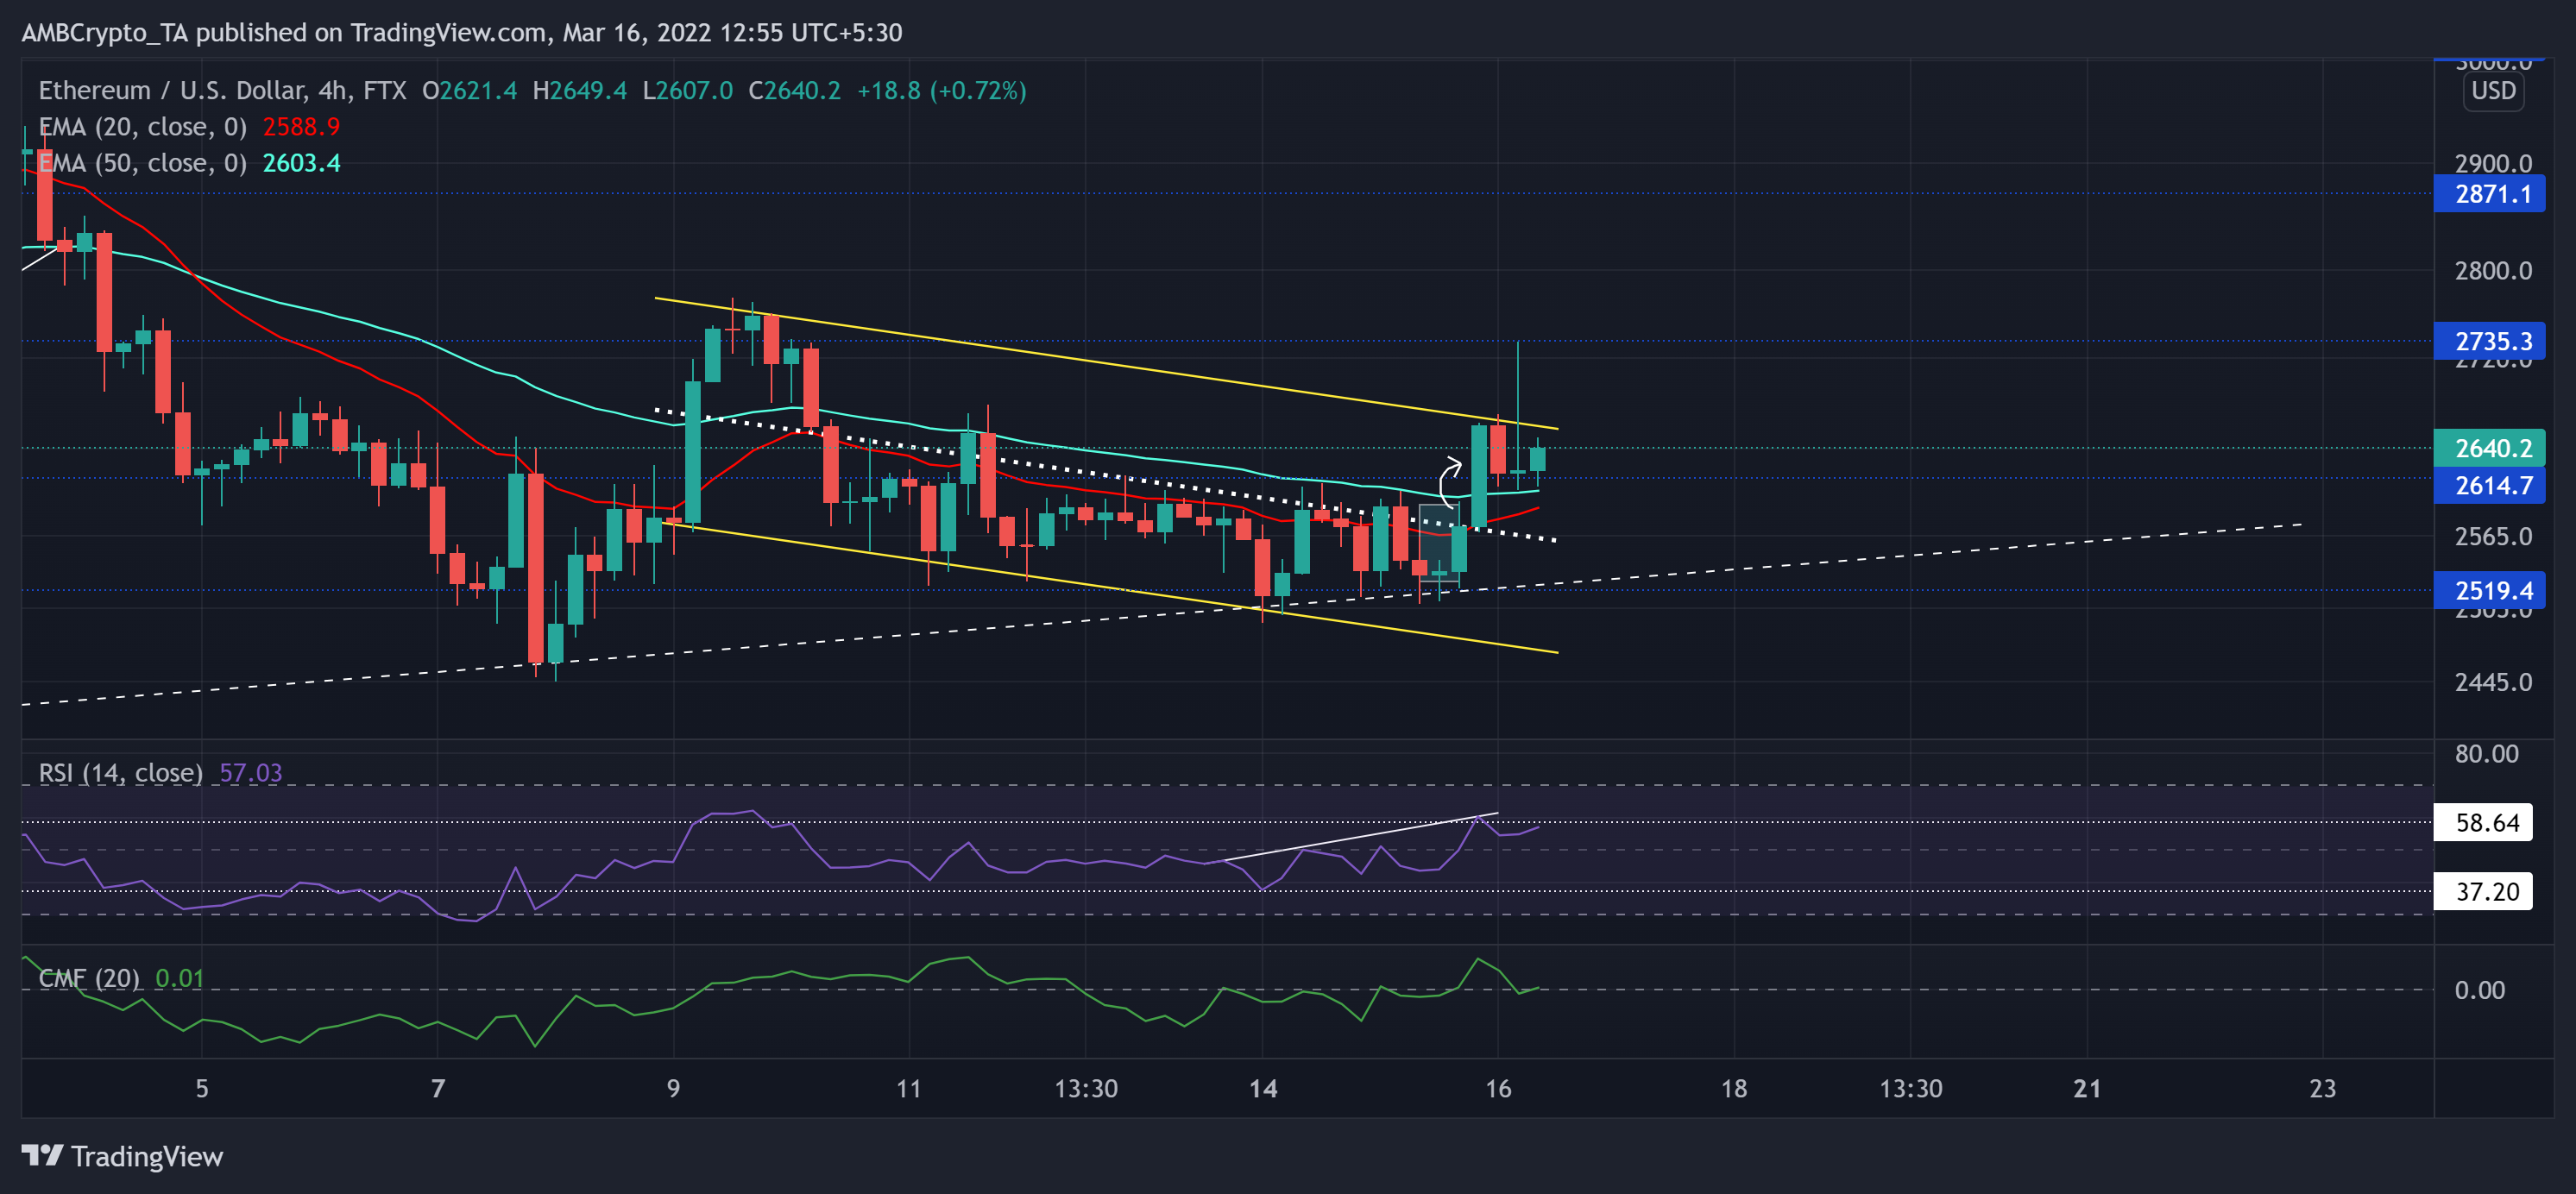
Since falling below the $3,200-mark, ETH found an oscillating range between the above mark and the $2,300 base.
After falling from its ATH, the bearish phase led ETH to lose more than half its value as it gravitated towards its six-month low on 24 January. Recently, ETH saw a morning star candlestick pattern that propelled a close above its 20/50 EMA. Now, the upper trendline of the down-channel posed an immediate barrier for the bulls.
At press time, ETH was trading at $2,640.2. The bullish RSI undertook a steep upturn from the 37-floor. A close above the 58 mark would position it for a test of its overbought region. Also, the CMF crossed the midline and affirmed the increased money volumes into the crypto.
Cosmos (ATOM)
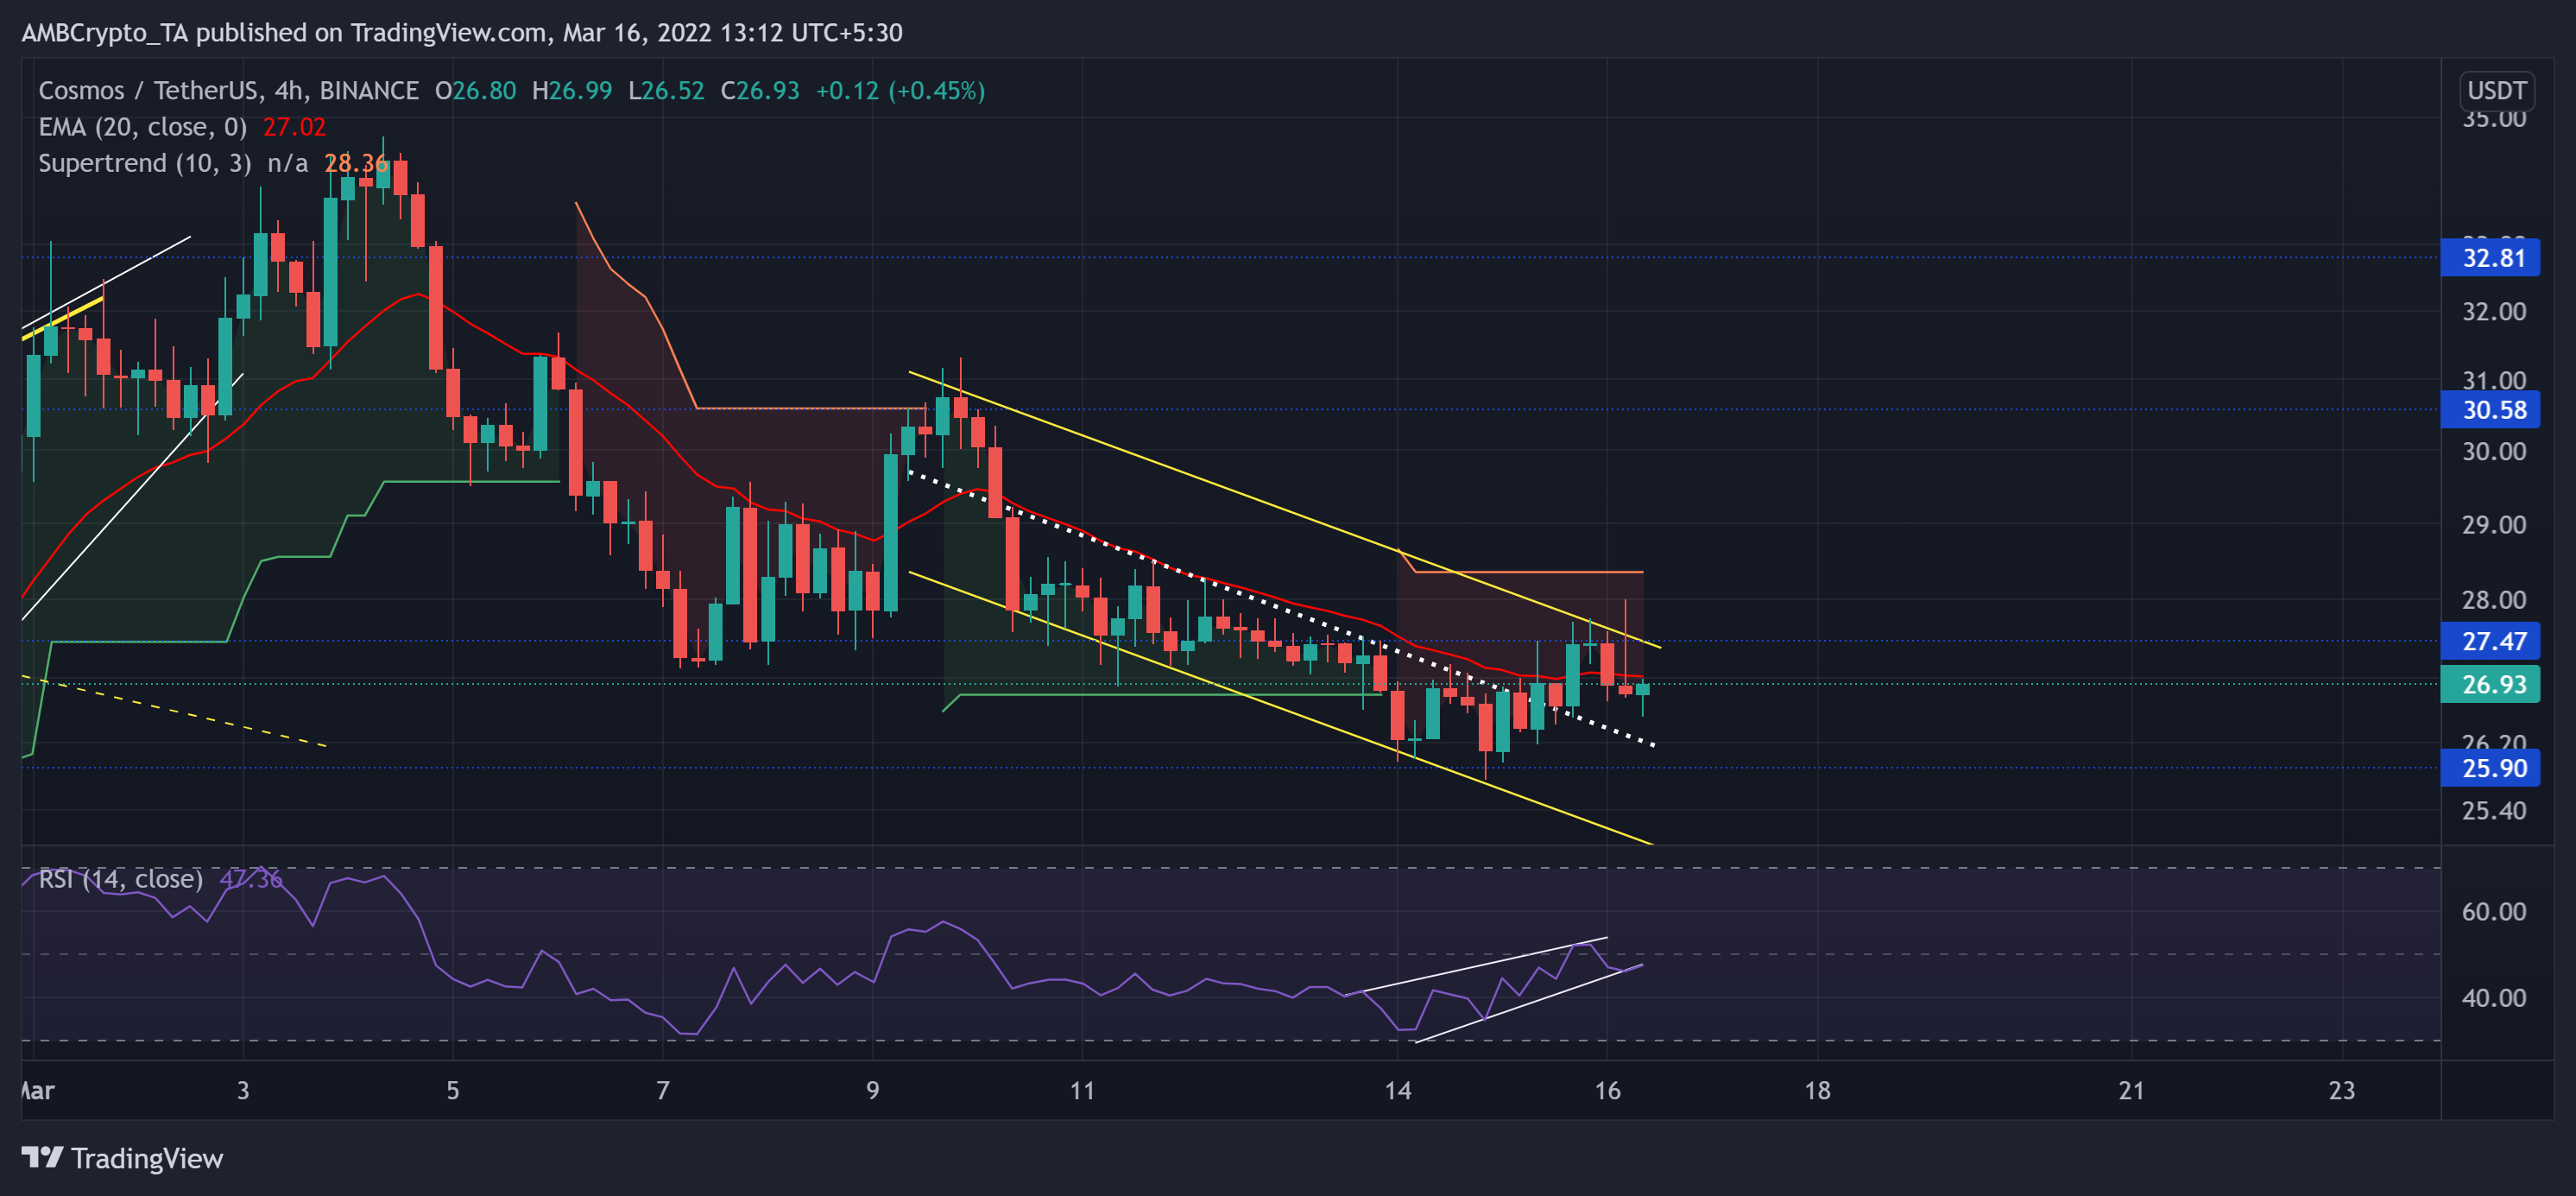
Since falling from the $43-mark, the alt had been on a sharp downturn by marking lower peaks and troughs. The recent sell-off phase led ATOM to lose nearly 30% (from 17 February) of its value until it touched its two-month low on 24 February.
Following this, the bulls stepped in as the alt rose in a rising wedge (white) while snapping the trendline support and reclaiming the $25-mark again. Now, the 20 EMA (red) would be an immediate hurdle for the bulls.
At press time, ATOM was trading at $26.93. The RSI saw a rising wedge growth but struggled to overturn its midline. a break below this pattern could lead to a near-term pullback. Further, the Supertrend continued to be in the red zone and favored the selling vigor.
Near Protocol (NEAR)

Since its ATH, NEAR lost more than 64% of its value and plunged toward its 11-week low on 24 February. It lost its crucial price points as the bears were in the driving seat.
NEAR adhered to its trendline support while diving towards the $7.6-long-term support. As a result, it bounced back to witness three-week trendline support (white, dashed). Consequently, it saw a down-channel (white) that tested the $10.3-mark.
At press time, the NEAR was trading at $10.128. The RSI saw a patterned growth but was yet to find a close above the equilibrium. Also, the AO corresponded with the increasing buying influence as it approached its zero-line.