Ethereum could see these levels before a strong reversal

Disclaimer: The findings of the following analysis are the sole opinions of the writer and should not be considered investment advice
Since striking its ATH on 10 November, the king alt has been on a steep downtrend in the last 11 weeks. The descent saw a clash between the buyers and sellers at the $4,000-mark Point of Control (red) that offered enormous liquidity. But as the bearish vigor prevailed, Ether (ETH) lost nearly half its value after losing the aforementioned mark.
A convincing close below the bearish rising wedge (yellow) would reaffirm the sellers’ edge. Before a possible bullish comeback, further retracements should find testing grounds near the $2,340-mark. At press time, ETH traded at $2,774.5 after noting an 8.44% 24-hour gain.
ETH Daily Chart
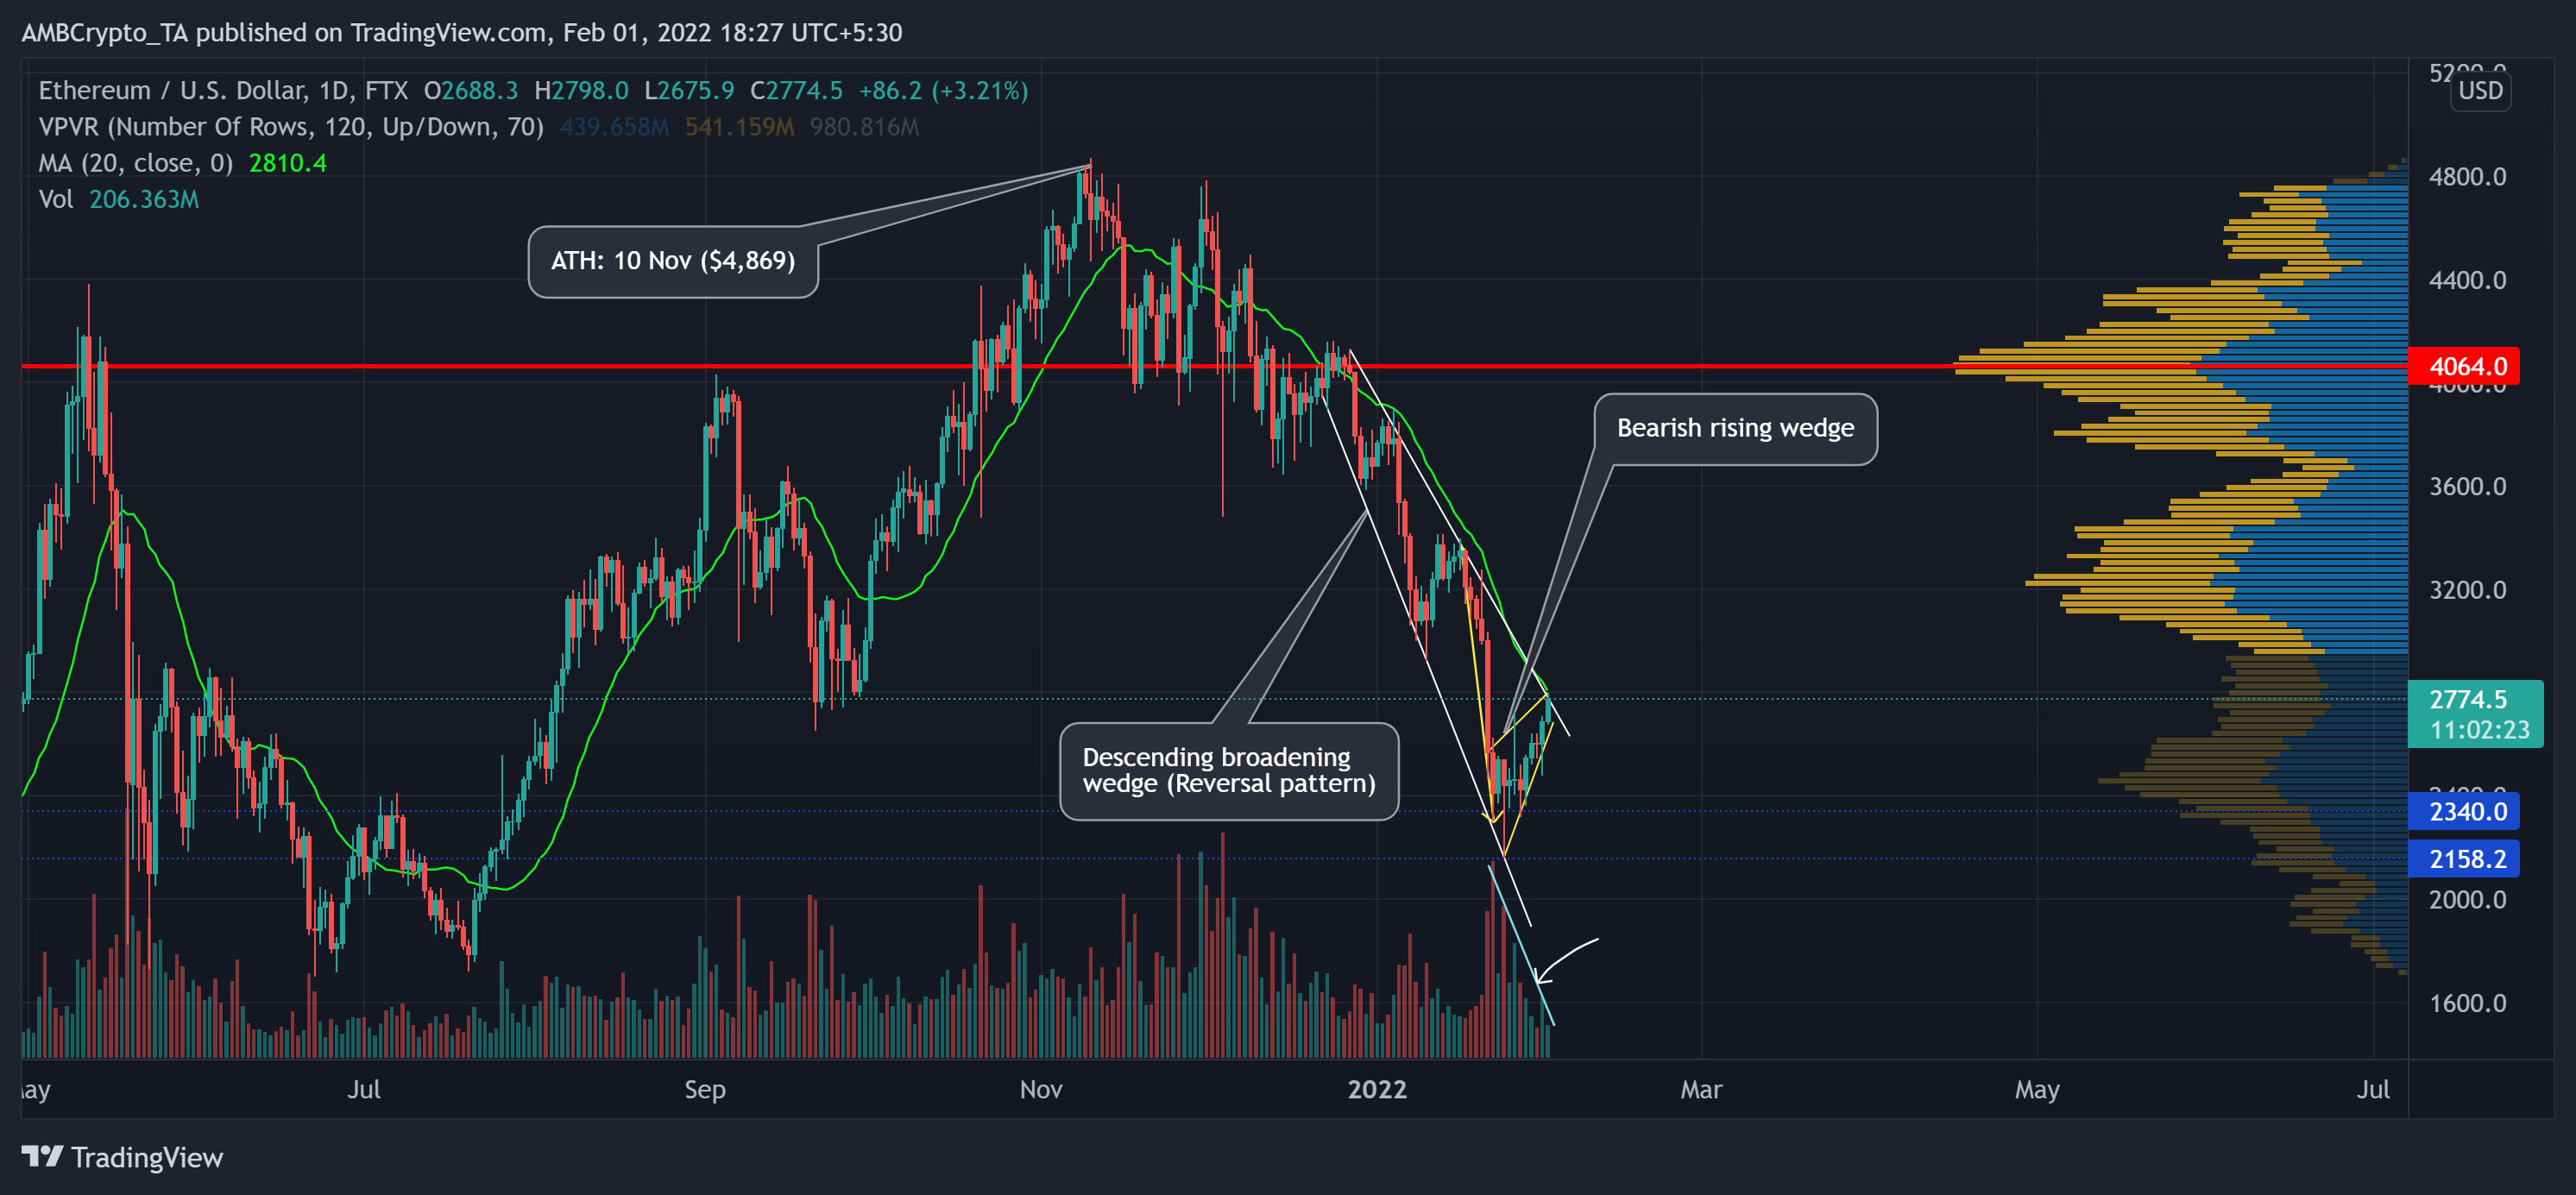
Since falling from its Point of Control, the altcoin witnessed multiple bearish engulfing candlesticks on amplified volumes that propelled ETH to poke its six-month low on 24 January. Also, the 20 SMA (green) stood as a sturdy resistance during the entire plummet.
Interestingly, ETH formed a descending broadening wedge (white) on a longer timeframe (one month). But buyers stepped in at the $2,158-zone as the substantial slump eased. Thus, forming a bearish rising wedge on its daily chart over the past two weeks.
This trajectory would justify a conceivable fall in the coming days before a bullish comeback from the $2,158-support. To top it up, the recent gains over the past week have been on decreasing volumes, pointing at a weak bullish move. Thus, any close above the upper trendline of the wedge or 20 SMA would most likely not result in a sustainable breakout.
Rationale
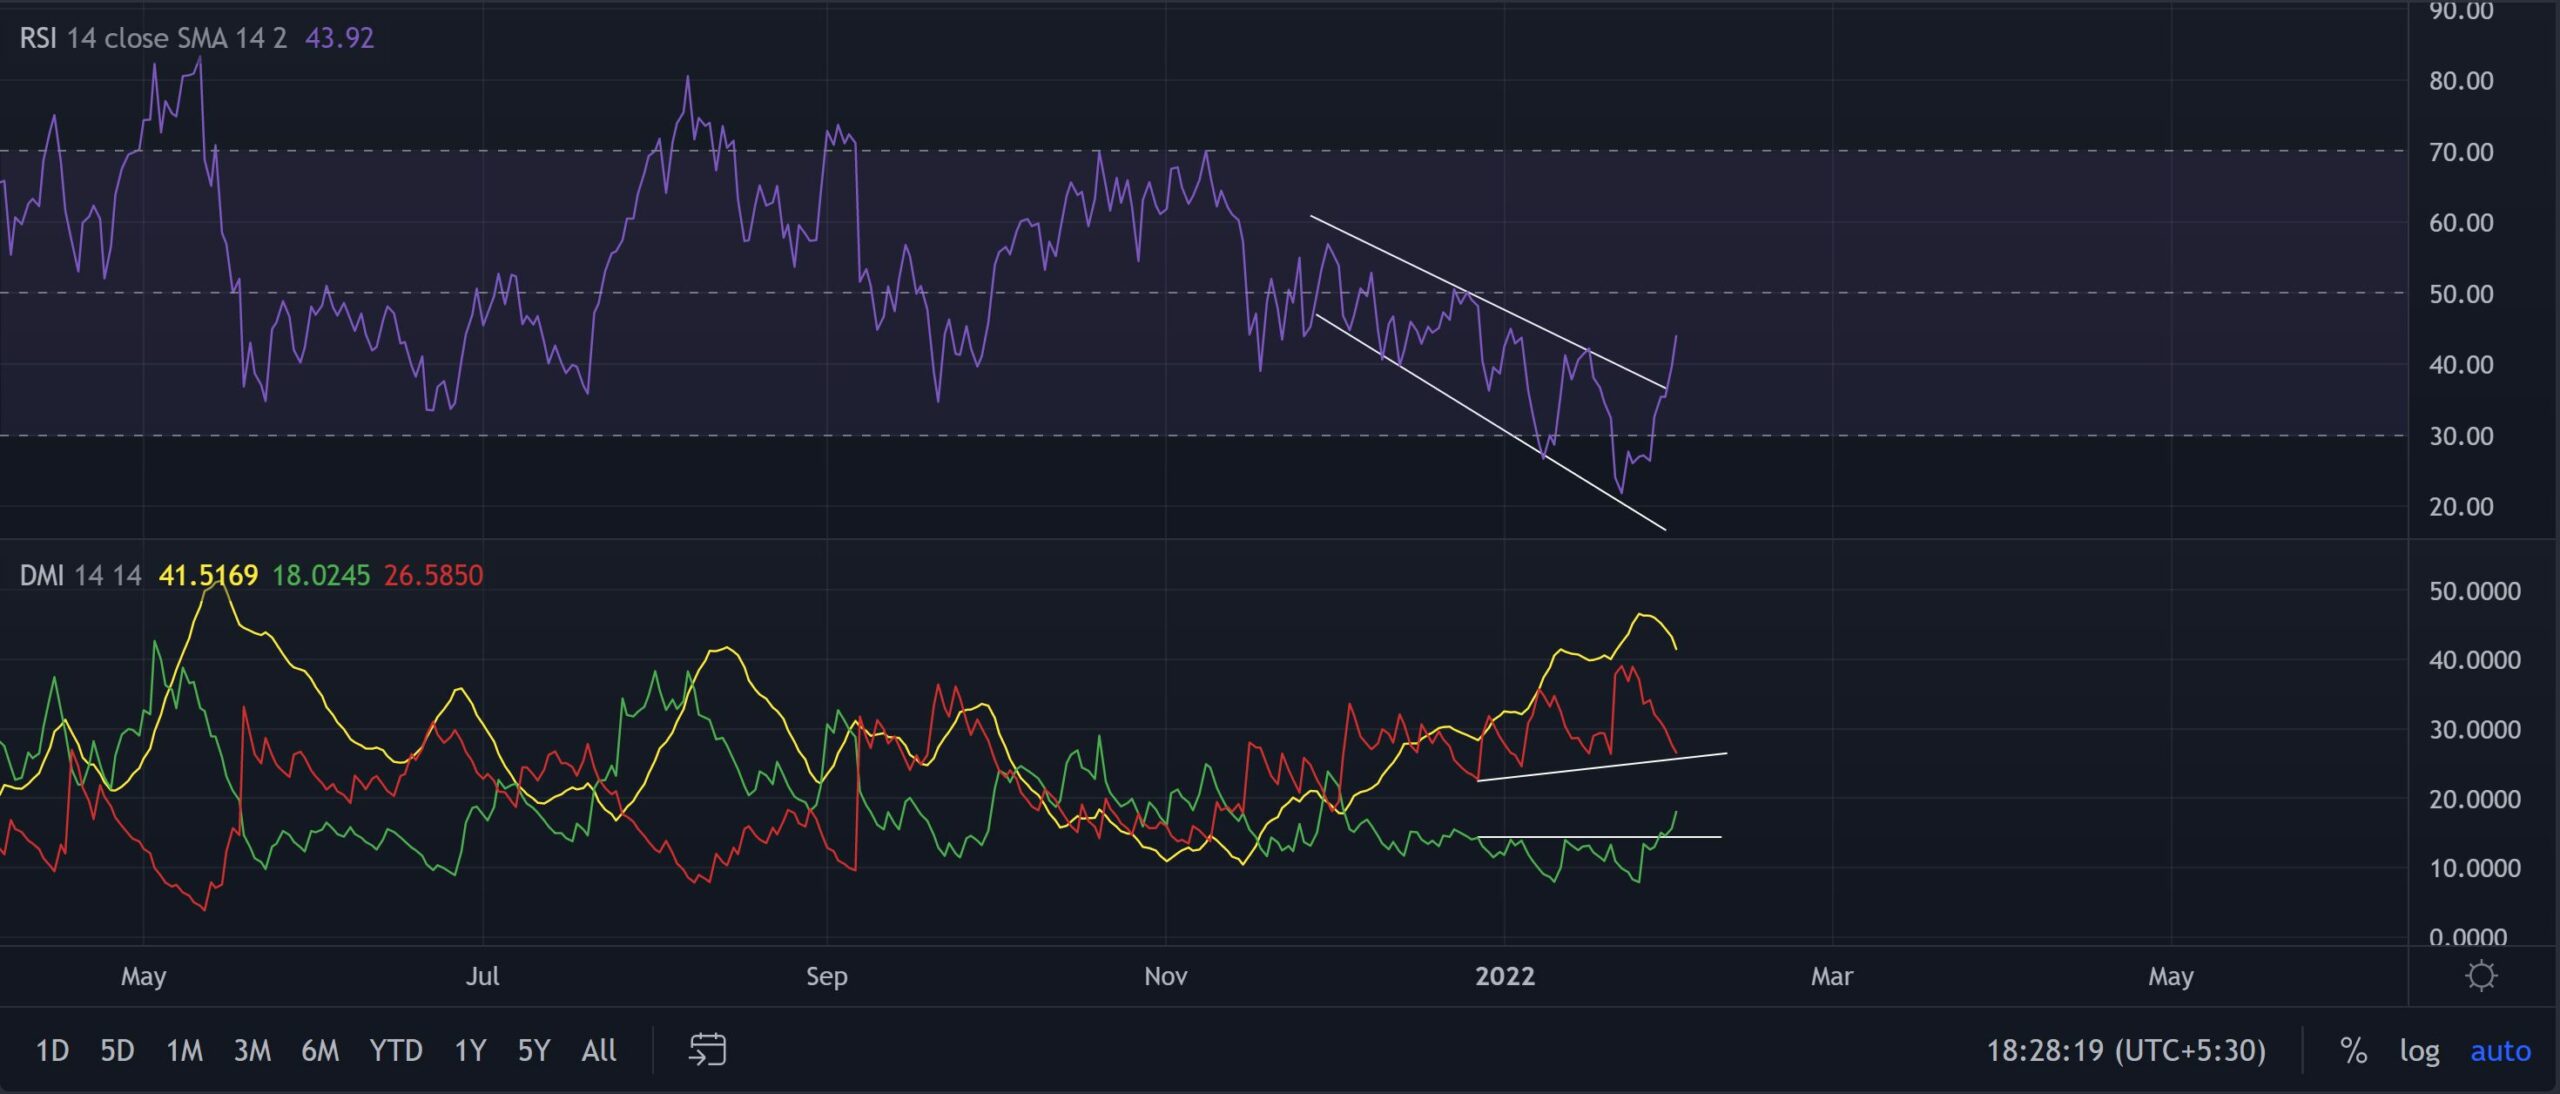
Although the RSIsaw a patterned breakout, it still had to topple the half-line resistance to confirm a bullish advantage. Now, the traders/investors must keep an eye for a close above the 20 SMA. If that happens, a potential false breakout might be lurking around the corner.
Additionally, the DMI lines refrained from a bullish crossover for nearly two months now. This reading reaffirmed the near-term bearish trend in favor of the bears despite the recent revival.
Conclusion
The chances of a potential breakdown from the bearish rising wedge were bright while the 20 SMA stood strong. In which case, the buyers should watch out when ETH retests either $2,340 or $2,158-support in the days to come. Should the bears dwindle, a sustained close above the pattern could lead to a potential bearish invalidation.


