Ethereum, Dogecoin, SAND Price Analysis: 30 December

As the crypto fear and greed index dipped into the ‘extreme fear’ zone, ETH and Dogecoin fell below their 20-50-200 SMA. Ether struggled to cross the $3,766-level while SAND looked at $5.4 as testing support.
The overall near-term technicals for these cryptos were skewed towards the bears.
Ethereum (ETH)
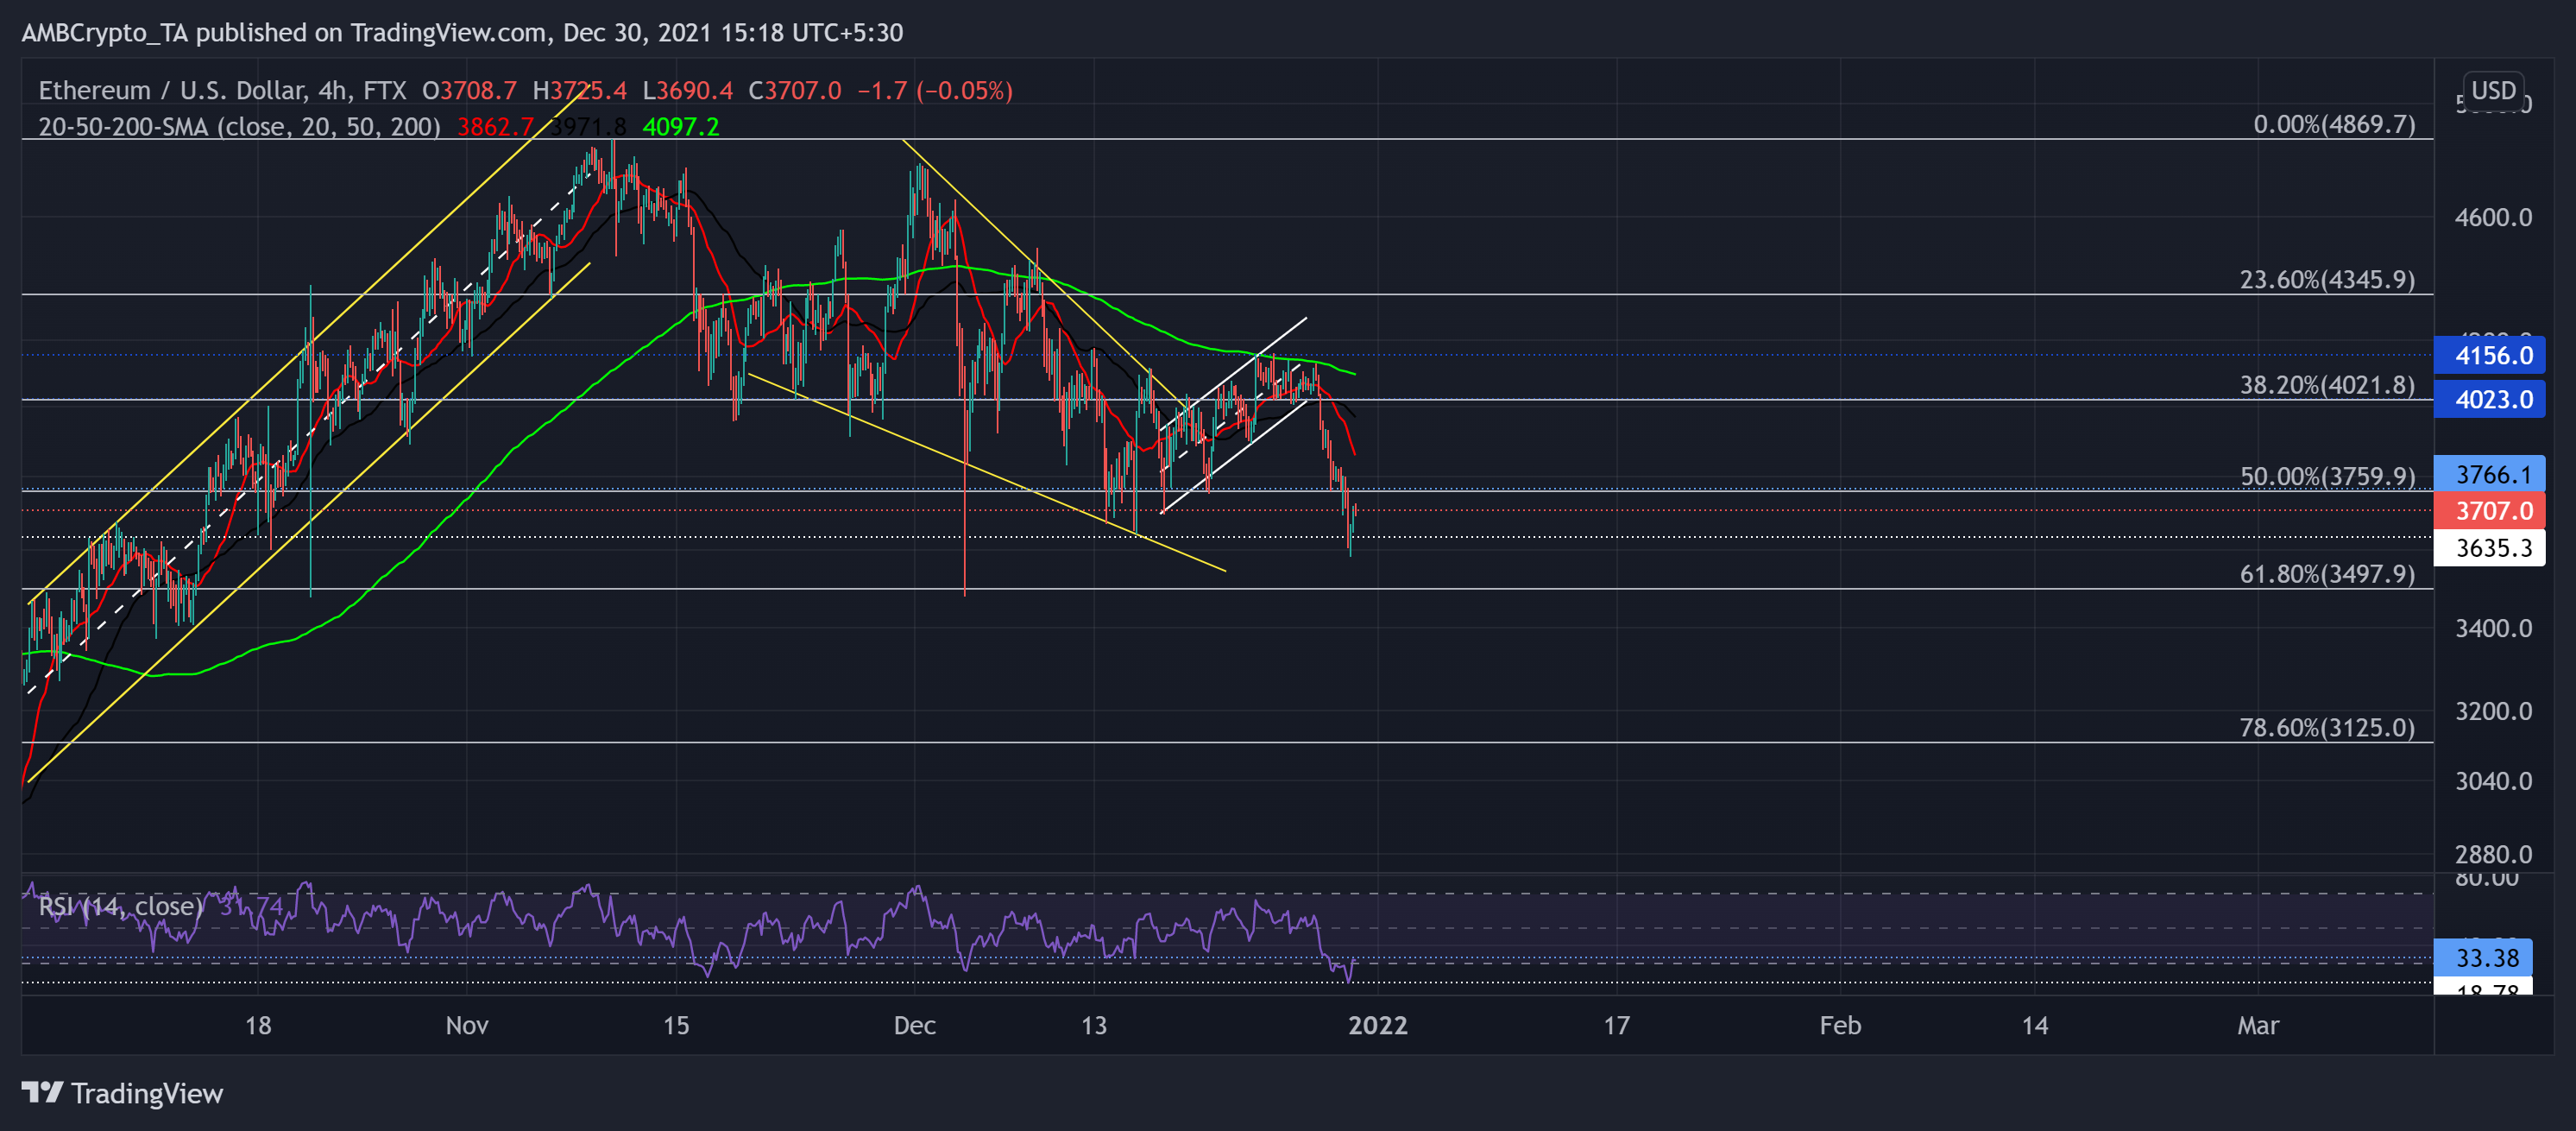
After a month-long falling wedge (yellow), ETH bulls lost the 38.2% Fibonacci support as the bears endeavored to test the immediate support at the $3,635-level. The up-channel (white) rally soon halted after the bulls retested the 200 SMA four times until succumbing to a broader sell-off.
ETH price action saw nearly 12 red candles out of the last 15 candlesticks. The alt still did not get a decent recovery chance. A convincing close above the $3,759 level would confirm the strength of the 11-week-long support (now resistance).
At press time, ETH traded below its 20-50-200 SMA at $3,707. The king alt’s RSI poked its record low at the 18-mark after a 39 point three-day plunge. It needed to cross the 33-mark resistance to confirm a strong reversal towards the midline.
Dogecoin (DOGE)
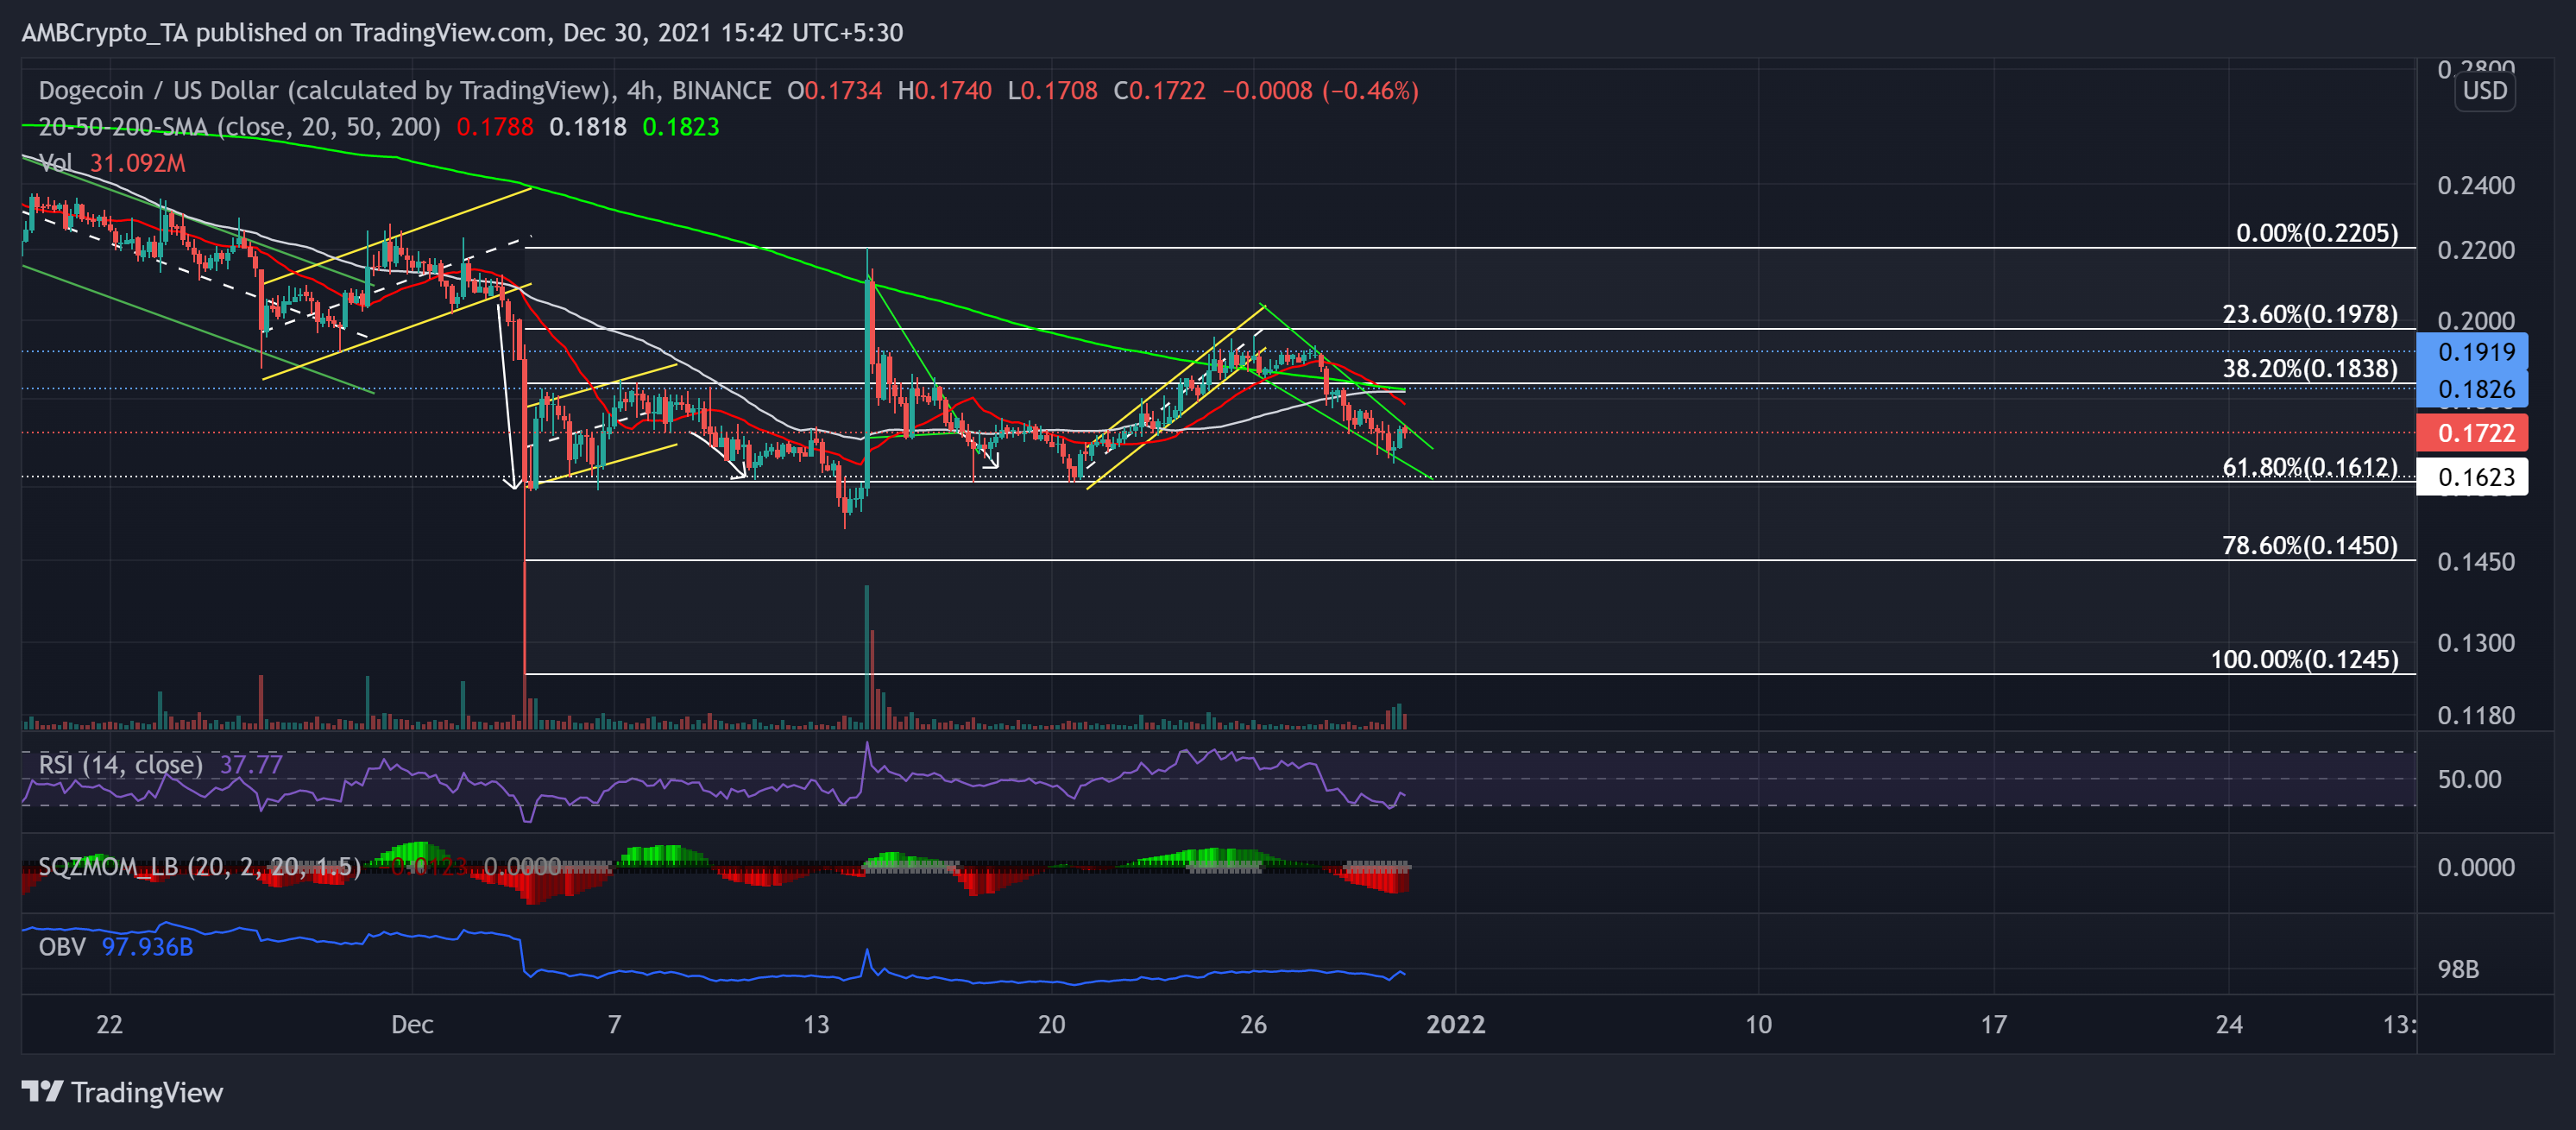
Over the past few days, DOGE saw a pullout after finding strong resistance at $0.1919-level for almost a month now. After retesting this level at least six times in the last week, the alt dipped in a falling wedge (green) on its 4-hour chart.
As a result, DOGE lost the 38.2% Fibonacci support but continued to ensure the 61.8% level. Moreover, the recent fall pushed the price below its 20-50-200 SMA.
Now, the meme-coin attempted a reversal breakout. The trading volumes and OBV saw a corresponding spike with the last two green candles, indicating a healthy retrieval attempt.
At press time, DOGE traded at $0.1722. The RSI saw a surge, but it needed to close above the midline to confirm any reversal chances. The Squeeze Momentum Indicator now flashed grey dots, hinting at a high volatility phase.
The Sandbox (SAND)
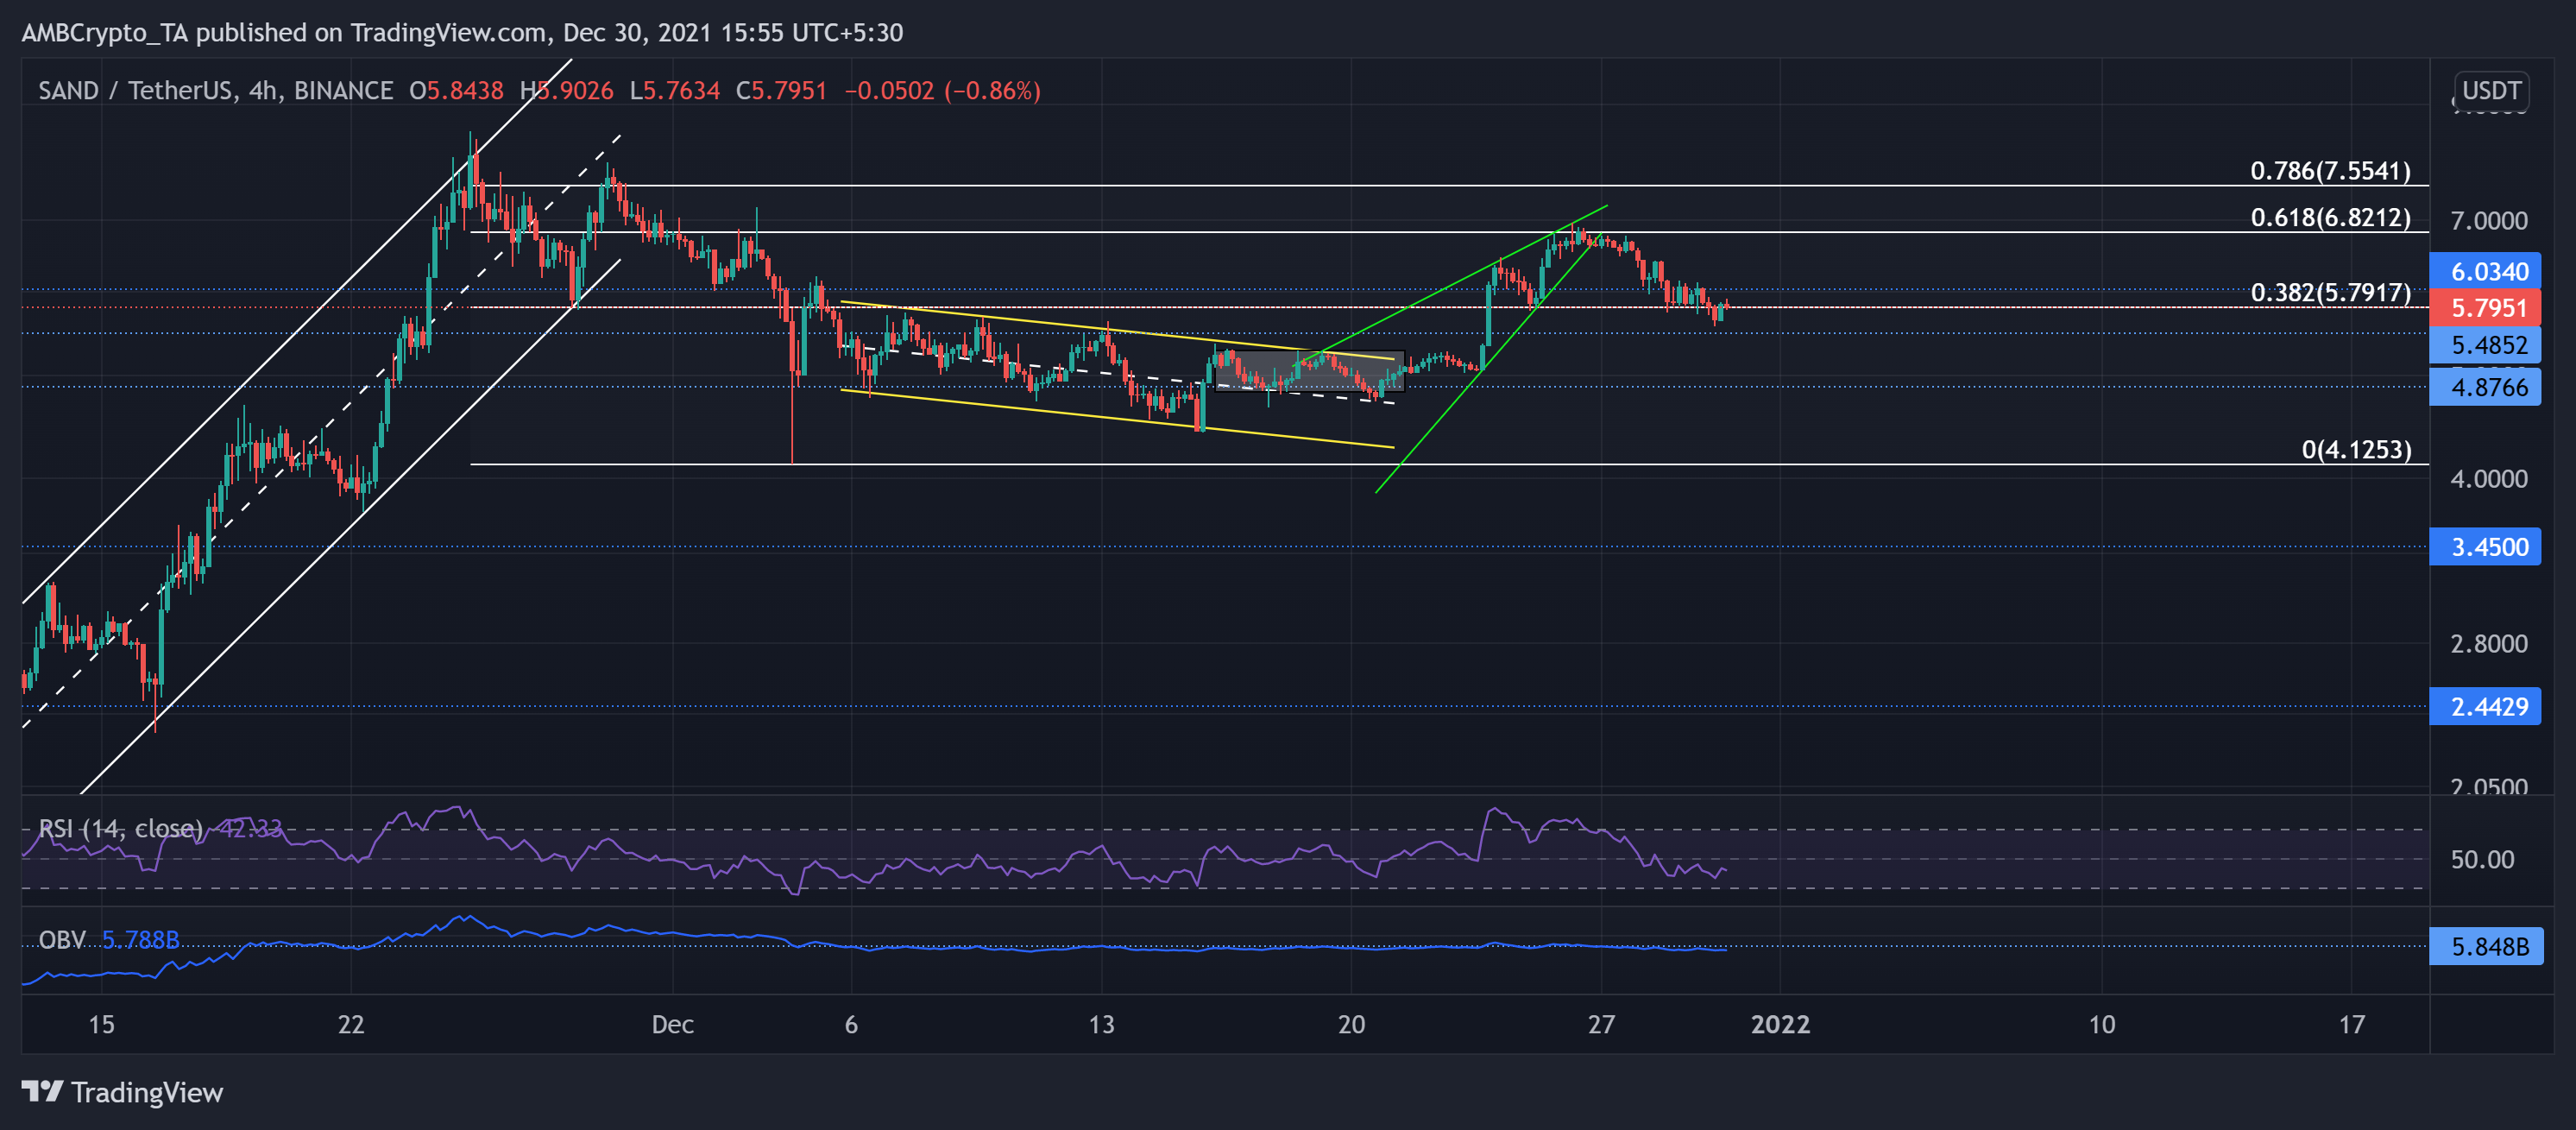
Since 5 December, SAND fell in a down-channel (yellow) on its 4-hour chart. As the bulls tested the upper channel multiple times, it finally saw a down-channel breakout.
SAND bulls crossed the 38.2% Fibonacci resistance as it reclaimed the crucial $6.03 support after forming a rising wedge (green, reversal pattern). As a result, it poked its three-week high on 26 December.
While the 61.8% Fibonacci stood as a strong resistance an expected breakdown occurred from the reversal pattern. SAND saw a 14.62% retracement over the past four days. Any further breakdown would find testing grounds at the $5.4-mark.
At press time, the alt traded at $5.7951. The RSI was at the 42-mark and displayed a bearish bias. Further, the OBV too recorded lower lows and resonated with the decreased buying pressure.